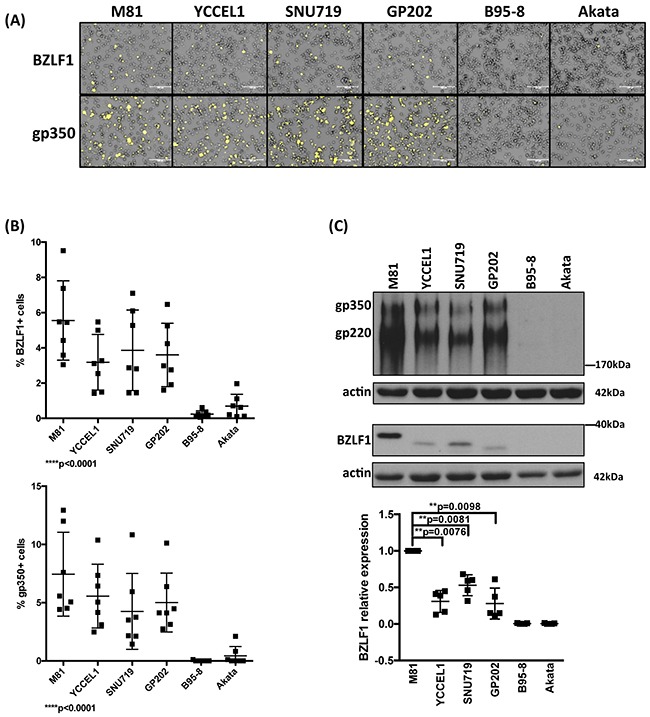
Figure 2. Lytic replication in LCLs infected with multiple EBV strains.

A. Representative BZLF1 and gp350 immunofluorescence stains performed on one set of LCLs generated with the same blood sample. B. The percentage of BZLF1- or gp350-positive cells in LCLs generated by the infection of 7 independent blood samples with 6 viruses. The 2 dot plots give the percentage of positive cells 4 weeks after infection. C. Representative BZLF1 and gp350-specific immunoblots performed on one set of LCLs generated with the same blood sample. Actin served as loading control. The 220kDa signals observed in the gp350-specific immunoblots are generated by a gp350 splice variant. The dot plot summarizes the BZLF1 protein levels observed after infection of five individual blood samples with the virus panel 1 month post-infection. The results are given relative to signals obtained with M81. The p-values shown in (B) give the results of global test analyses by using global mixed linear model analyses with random effect. In (C) we applied log-transformation of fold-changes for the analysis of normalized data without Bonferroni correction. Error bars represent the mean with s.d.
