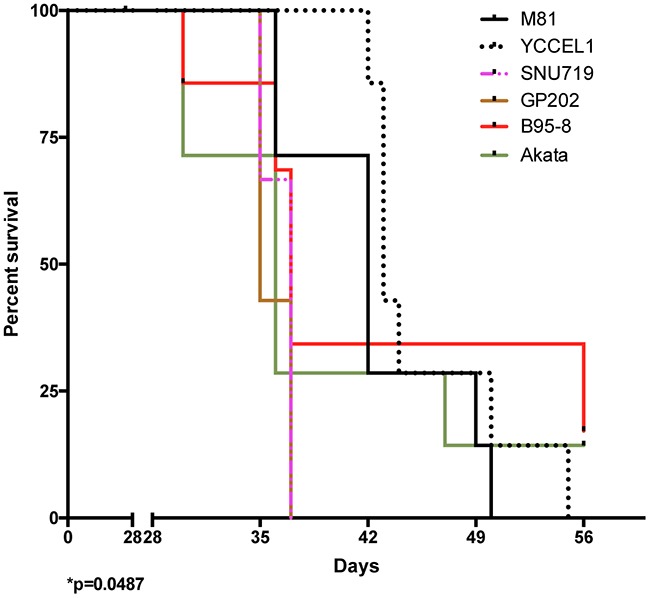
Figure 3. Survival in mice infected with various EBV strains.

The schematic shows Kaplan-Meier survival curves at multiple time intervals after infection with B cells exposed to one of 6 EBV strains. Each group included 7 mice. The Log-rank test shows a significant difference in survival (p=0.0487). Please also see the Supplementary Figure 5 and Supplementary Table 2.
