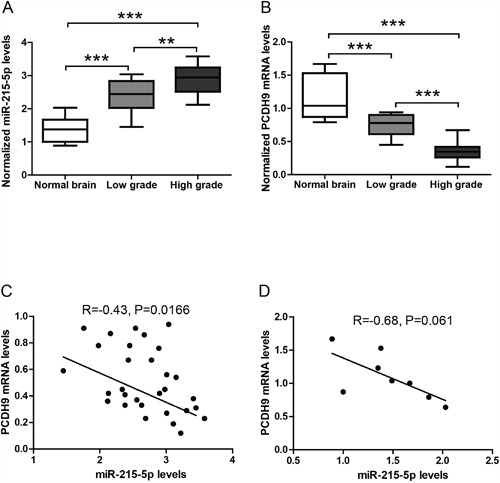
Figure 2. The expression levels of miRNAs and PCDH9 in human gliomas.

The qRT-PCR results showing the relative miR-215-5p levels A. and PCDH9 mRNA levels B. in normal brain tissues (n=8), low-grade gliomas (n=12) and high-grade gliomas (n=18). Association analysis of miR-215-5p and PCDH9 mRNA levels in glioma tissues C. R=-0.43, P=0.0166 and normal brain tissues D. R=-0.68, P=0.061. Data were presented as box-whisker plots. For all, **P<0.01; ***P<0.001.
