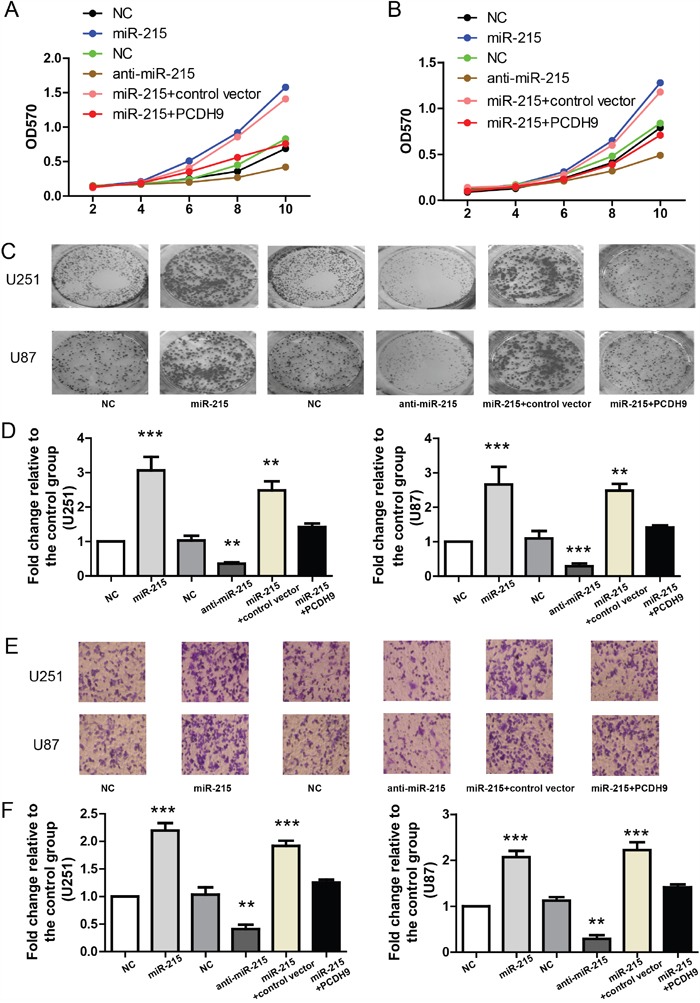
Figure 4. The miR-215-5p promotes glioma phenotypes via inhibiting PCDH9 expression.

A. MTT assays showing the growth curves of U251 (A) n=3 and U87 B. n=3 after transfection with indicated miRNAs or vectors. Representative images of clone formation C. and its quantification D. showing the clone numbers after transfection with indicated miRNAs or vectors in U251 (n=3) and U87 (n=3) cell lines. Representative images of in-vitro migration assays E. and its quantification F. showing the migrated cells after transfection with indicated miRNAs or vectors in U251 (n=3) and U87 (n=3) cell lines. For all, **P<0.01; ***P<0.001.
