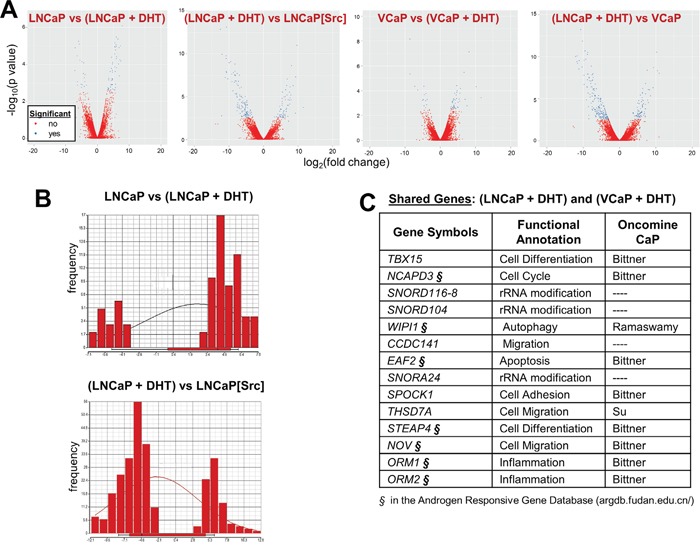
Figure 2. Gene expression trends induced by DHT or Src: Src downregulates whereas DHT upregulates.

A. Volcano plots comparing significantly up- (right arm) and downregulated (left arm) genes between PC cell lines +/- DHT. B. Comparison of differential gene expression levels with gene frequency, to assess the effects of DHT in LNCaP (top panel) or Src vs. DHT-regulated genes in LNCaP. C. Among the 15 most DHT-regulated genes shared in LNCaP and VCaP cells, several (§) were identified in the Androgen Responsive Gene Database (http://argdb.fudan.edu.cn/) or were shown to be differentially expressed in prostate cancer compared to control tissues in Oncomine studies (http://www.oncomine.org).
