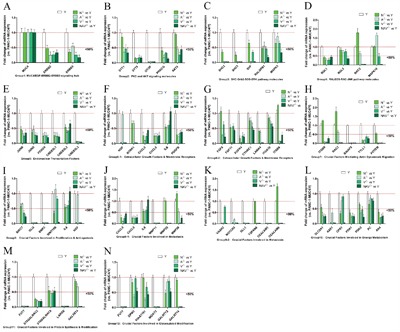
Figure 3. The expression of most DEGs of MUC4/Y triggering was reversed in the absence of unique MUC4/Y domains(NIDO, AMOP, vWD, or synergy).

Representative downstream effector molecules of MUC4/Y (i.e. DEGs of MUC4/Y over-expressing PANC-1 cells compared with controls in earlier research [16], as shown in Additional File 4) were classified as twelve feature subsets, i.e. Group1-12. QPCR validation results of altered gene expression of these molecules in lacking-domains groups (N△, A△, V△, NAV△) and control group (MUC4/Y-overexpression). The expression quantity in controls is defined as 1.0, so under the line of “1.0” represents mean expression quantity of experimental groups below that of control group, and under the line of “0.5” represents mean expression quantity of experimental group less than 50% expression of control group.
