
Figure 3. Expression of HSPB8 in MCF-7 cell line.
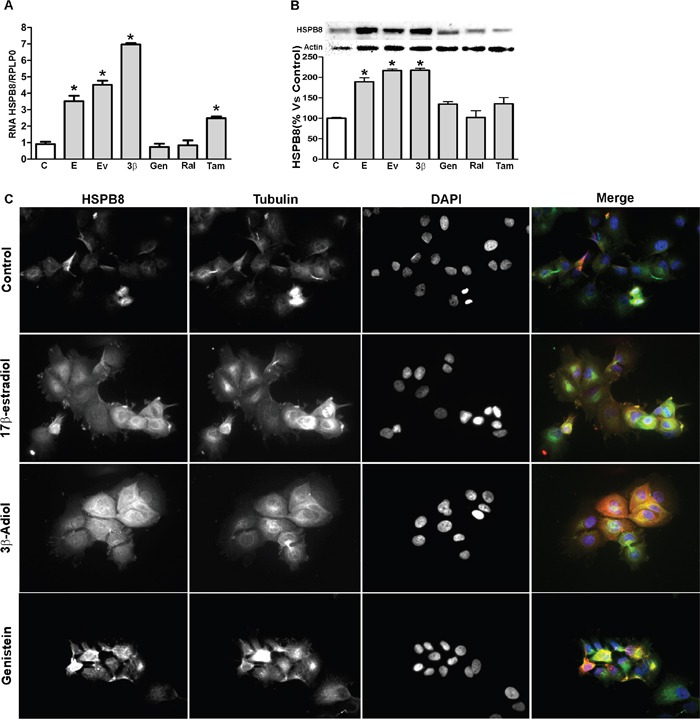
HSPB8 mRNA and protein levels were quantified by real-time RT-PCR analysis. A. and Western blot analysis B. 2 days after treatment with DMSO (Control), 17β-estradiol (10nM), estradiol valerate (10nM), 3β-Adiol (1μM), genistein (1μM), raloxifen (1μM) and tamoxifen (1μM). Statistical analysis was performed by one-way ANOVA followed by Bonferroni multiple comparison tests. Representative pictures of immunofluorescence staining of HSPB8 (red, anti-rabbit) and α-tubulin (green, anti-mouse) in MCF-7 cells, treated as above for 2 days. DAPI (blue) was used to stain DNA C. *p<0.05 vs Control. Values represent the mean from three independent experiments. C. Control cells; E: 17β-estradiol; EV: estradiol valerate; 3β: 3β-Adiol; Gen: genistein; Ral: raloxifen; Tam: tamoxifen.