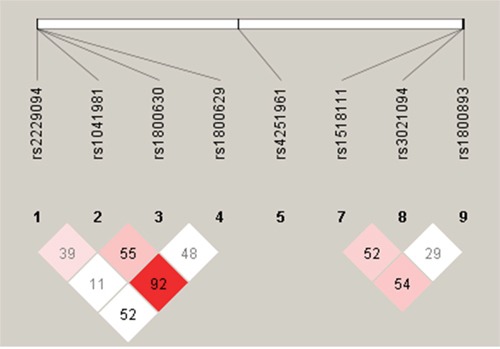
Figure 1. LD plot of the 8 SNPs in genes IL-10 and TNF-α.

Notes: LD plot showing LD patterns among the 8 SNPs in genes IL-10 and TNF-α genotyped in the 590 samples. The LD between the SNPs is measured as r2 and shown (×100) in the diamond at the intersection of the diagonals from each SNP. r2 = 0 is shown as white, 0< r2<1 is shown in pink and r2 =1 is shown in red. The analysis track at the top shows the SNPs according to chromosomal location.
