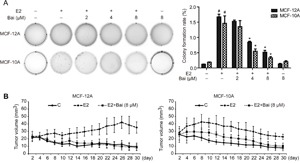
Figure 3. The effects of baicalein on E2-induced tumorigenesis in vitro and in vivo.

A. Cell colonies were grown in soft agar and cultured for 21 days after treatment with E2 or E2 plus baicalein for 5 weeks. Images of representative colonies were captured using a ChemiDoc XRS+ system; original magnification, 1×. Statistical analysis shows the colony formation rate relative to the total number of cells. Data are shown as means ± SEM (n = 3). *P < 0.05 vs. E2, #P < 0.05 vs. control. B. Cells (2 × 10⁶ in 50 μl Matrigel) were implanted into the mammary fat pads of NOD/SCID mice after the indicated treatment for 10 weeks (n = 6 per group). The tumor volume was calculated by caliper measurements every other day from the time of detection for 30 days. The results are presented as mean tumor volume ± SEM (n = 6) and are representative of three independent experiments.
