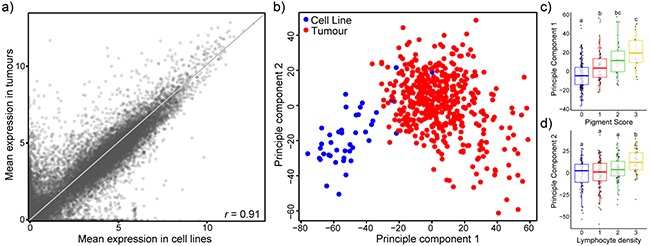
Figure 1. Transcriptional comparison of 42 melanoma cell lines with 471 TCGA melanoma tumour samples suggests overall transcriptional similarity.

a. Scatterplot of mean expression values (log2[TPM+1]) of 20,460 coding genes in melanoma cell lines (horizontal) and tumours (vertical). Pearson’s correlation coefficient r = 0.91. Grey line depicts the reflection line (y=x). b. The 5,000 most variable genes were used for principal component analysis and the first two components are displayed. Most cell lines cluster apart from tumours. Colours of the points indicate sample type: cell line (blue), tumours (red). c,d. Boxplots of PC1 broken down by tumour pigment score (c) and PC2 broken down by lymphocyte density (d). ANOVA followed by Tukey’s HSD (p<0.05).
