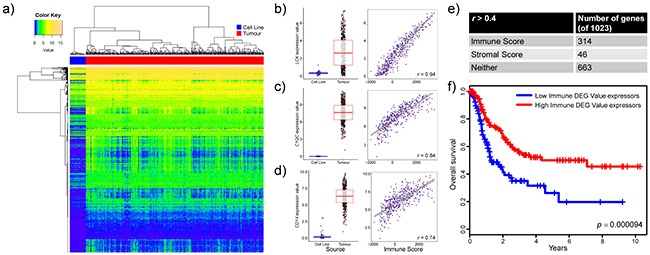
Figure 2. Many of the transcriptional differences between melanoma cell lines and patient tumours are related to immune signatures.

a. Heatmap representation of the top 5% differentially expressed genes (Benjamini-Hochberg adjusted p value, Welch’s t test) in cell lines compared to tumour samples. All genes were investigated in tumours for potential correlation with the ESTIMATE paradigm stromal and immune scores. b,c,d. Differential expression (boxplot) and Immune Score correlations (scatterplot) are displayed for representative genes: (b) LCK, (c) C1QC, and (d) CD14. Boxplots show gene expression values (log2[TPM+1]) stratified by sample source (cell line or tumour). Boxes represent interquartile ranges and points represent individual sample values. Scatterplots show gene expression values (log2[TPM+1]) versus Immune scores (ESTIMATE algorithm) of tumours. Pearson’s correlation coefficient is displayed in the lower right corner. e. Table depicting the number of genes in the top 5% differentially expressed genes that strongly correlate (r > 0.4) with the ESTIMATE Immune score, ESTIMATE Stromal score or neither scores. f. Kaplan-Meier curves (ten year overall survival) for patients with high Immune DEG Values (red line, n=146) and those with low Immune DEG Values (blue line, n=146). p = 0.000094, log-rank test.
