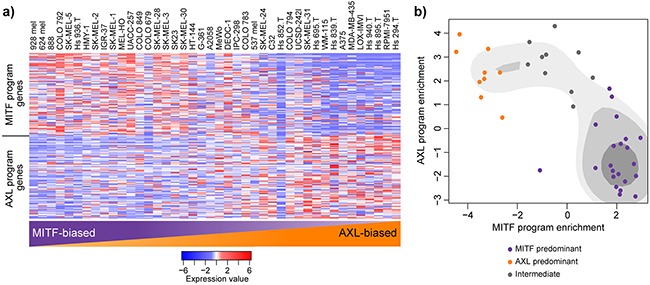
Figure 3. MITF- and AXL-associated expression programs are recapitulated in melanoma cell lines.

a. Relative expression (centered, scaled) of the MITF program genes (top) and AXL program genes (bottom) in 42 melanoma cell lines. Cell lines are sorted based on their gene set enrichment of MITF versus AXL gene sets from highest (left) to lowest (right) as determined by GAGE. b. Scatterplot representation of cell line AXL and MITF gene set enrichment as determined by GAGE. Shading represents kernel density estimates of the data. Coloured dots represent clustering as structured by Gaussian kernels (purple: MITF predominant; orange: AXL predominant; grey: intermediate).
