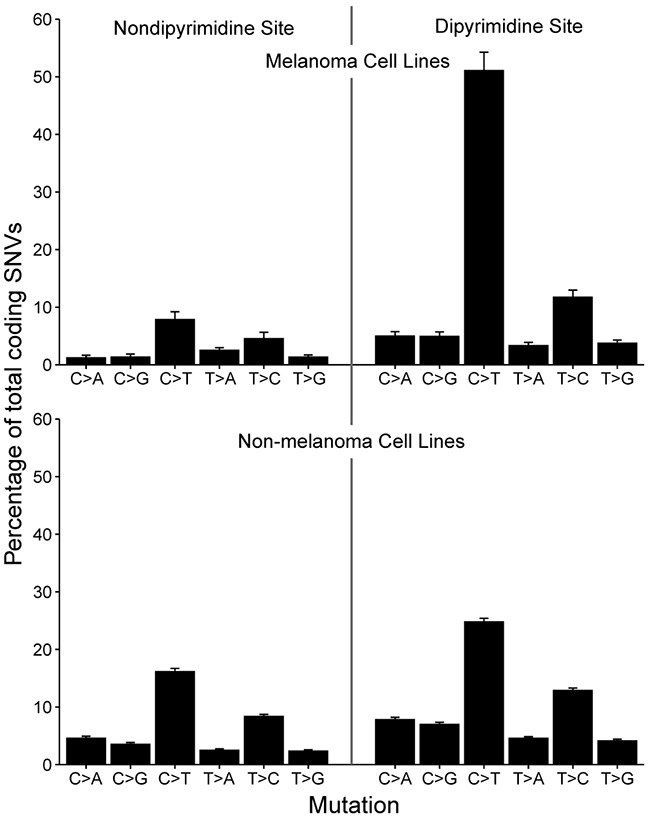
Figure 4. Mutation spectrum in melanoma versus non-melanoma cell lines.

Barplot depicting the spectrum of somatic variants at dipyrimidine and non-dipyrimidine sites in melanoma (n=42) and non-melanoma (n=567) cell lines. There is an excess of C>T transitions in melanoma cell lines, indicative of UV-exposure and sun-induced DNA damage. Bars denote mean percentage of total SNVs and error bars depict standard error of the mean.
