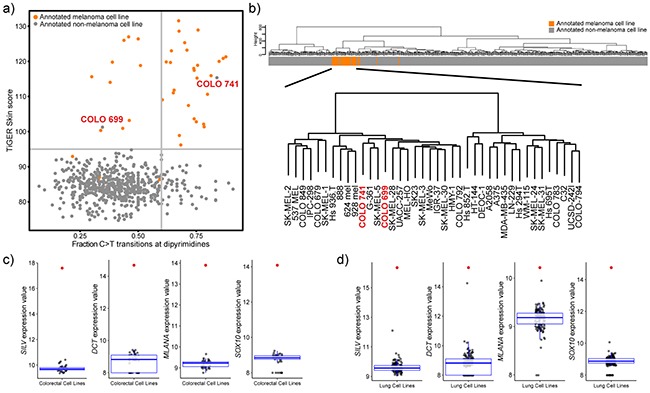
Figure 5. Tissue of origin analysis for melanoma cell lines.

a. Scatterplot representation of fraction of C>T transitions at dipyrimidine sites and the weighted expression of skin genes. Vertical line at x=0.6 delineates UV mutational signature positive (>0.6) from UV mutational signature negative samples (<0.6). Horizontal line depicts a TiGER Skin Score of 95 and delineates the majority of melanoma samples from non-melanoma samples. b. Unsupervised hierarchal clustering of 610 cell lines based on gene expression data (VSD normalized values) of the 5,000 most variable genes. Clustering was done using Euclidean distance and Ward linkage. The bar represents the cell line tissue of origin (orange: melanoma cell line; grey: non-melanoma cell line). Bottom clustering depicts a closer view of the melanoma cluster and shows that COLO 741 and COLO 699 cell lines cluster with melanoma samples. c,d. Boxplot representation of the expression (VSD normalized values) of skin-specific genes: SILV, DCT, MLANA, and SOX10 in annotated colorectal cell lines (c) and annotated lung cell lines (d). Red points represent the values for the COLO 741 cell line (c) or the COLO 699 cell line (d).
