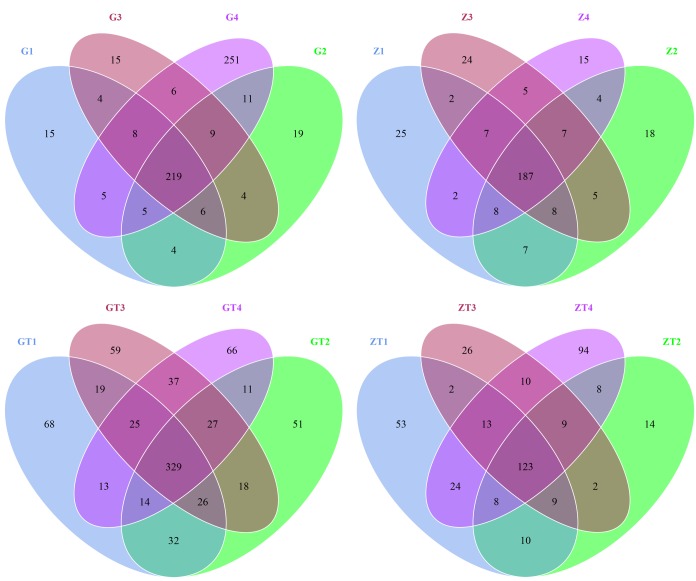
Figure 2. Scalar-Venn representation of shared genera among microbiomes associated with 4 sites in two patients before and after treatment.
G1-4 and Z1-4 meaned the samples from patient G and patient Z before treatment respectively. GT1-4and ZT1-4 meaned the samples from the patient G and patient Z after treatment (represent as GT and ZT) respectively. The overlap section represented the shared OTUs between different samples.

