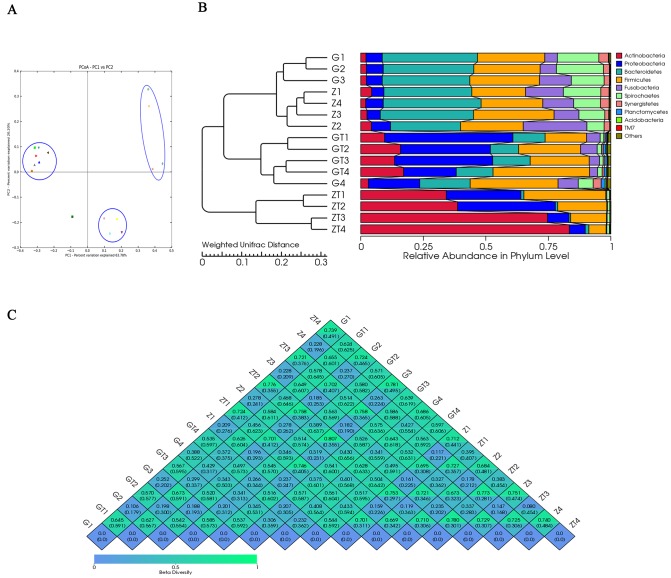
Figure 4. Beta-deversity analysis index.
A. showed Principal coordinate analysis (PCoA) scores plot based in weighted UniFrac metrics. Each symbol represented each sample from patient G and Z before and after treatment. Principal components (PCs) 1 and 2 explained 63.78% and 20.20% of the variance respectively. B. showed the phylogenetic tree based on the Weighted UniFrac. The left part is the phylogenetic tree based on the similarity between samples; the right part is the heatmap of relative abundance in phylum level. C. showed the β-diversity index heatmap.The numerical values within the squares indicated thecoefficient of difference between each two samples. The green color represented greater difference, and the blue color represented smaller difference.

