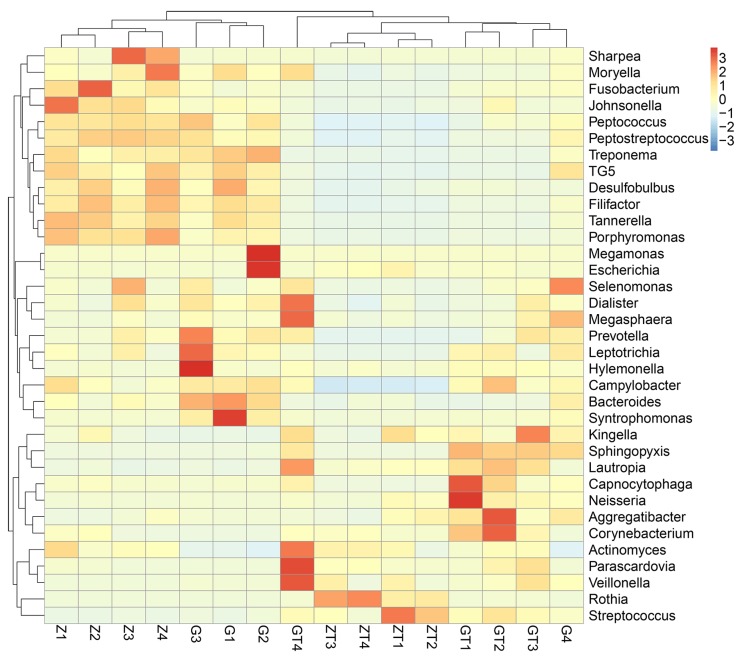
Figure 6. Relative abundance of the top 35 most prevalent genera in subgingival plaque samples before and after intervention.
Only genera with more than 1% abundance were included. Each Bar displayed the normalized relative abundance, colors reflected relative abundance from low (blue) to high (red).

