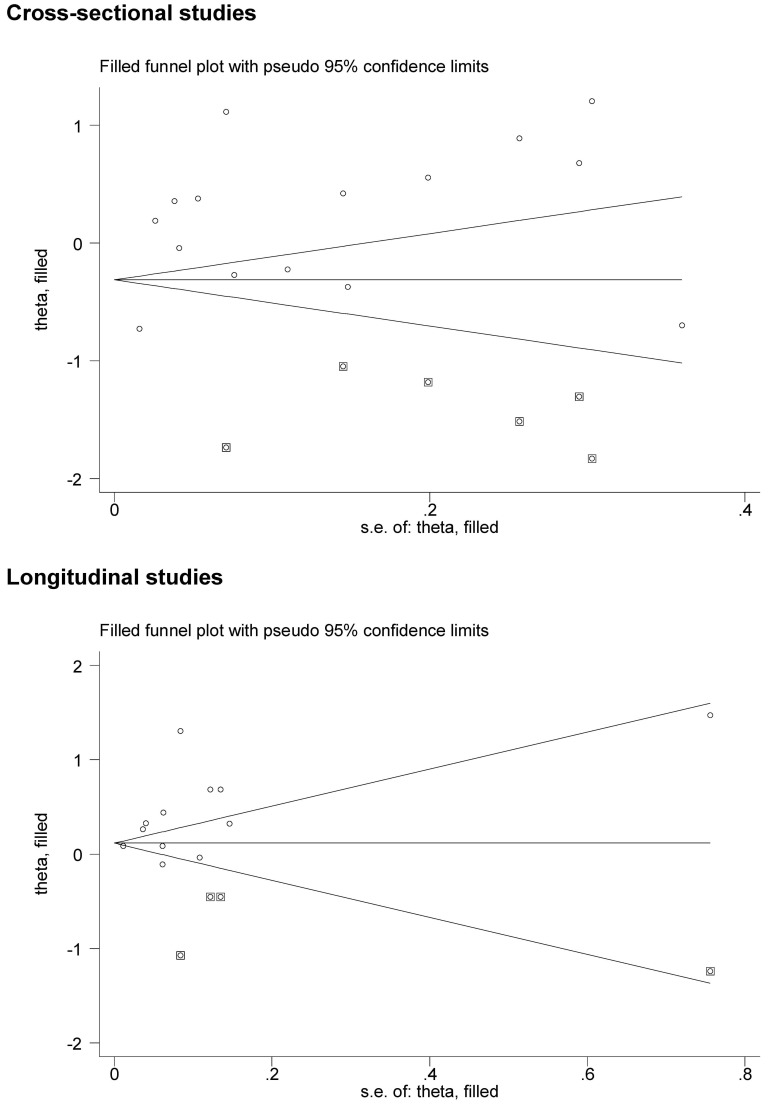
Figure 3. The filled funnel plots for the prevalence and incidence of CKD conferred by the presence of HCV infection.
Actual studies are denoted by the hollow circles, and potential missing studies in need to achieve symmetry are denoted by the solid squares. The theta in the y-axis represents the log(odds ratio) for cross-sectional studies and the log(hazard ratio) for longitudinal studies. The s.e. of theta in the x-axis represents the standard error of log(odds ratio or hazard ratio).

