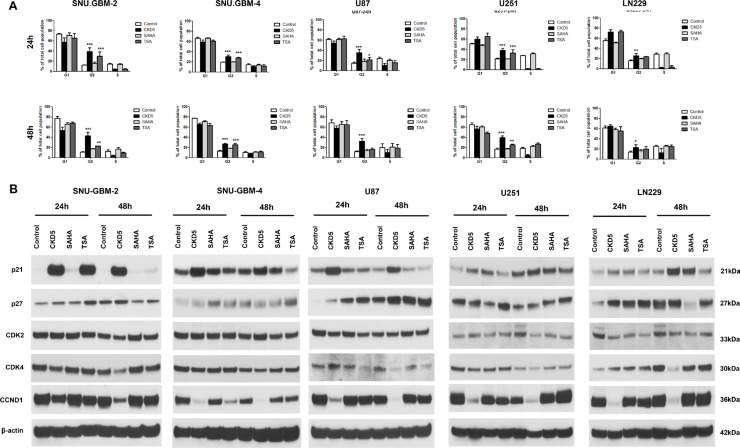
Figure 2. Cell cycle analysis and expression of cell cycle regulators.
Cell cycle distributions in glioblastoma cells with HDACI treatment. The analysis of cell cycle arrest in glioblastoma cells showed that the percentage of cells in G2-M phase is induced by 1.5- to 42.1-fold by CKD5 at 48 h. *p < 0.05, **p < 0.01, ***p < 0.005.

