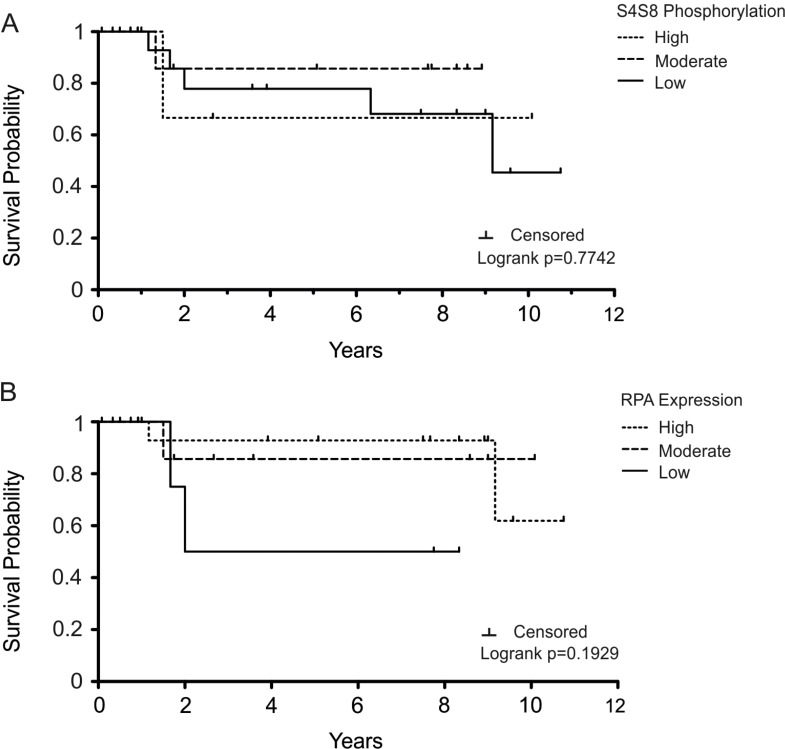
Figure 3. Kaplan-Meier survival plot examining OSCC survival probability in the subgroup of patients who were treated with chemotherapy/radiation therapy.
Survival probability is displayed in comparison to (A) S4S8-RPA phosphorylation and (B) overall RPA expression levels (low, moderate, high). Censored data is indicated by a tick mark.

