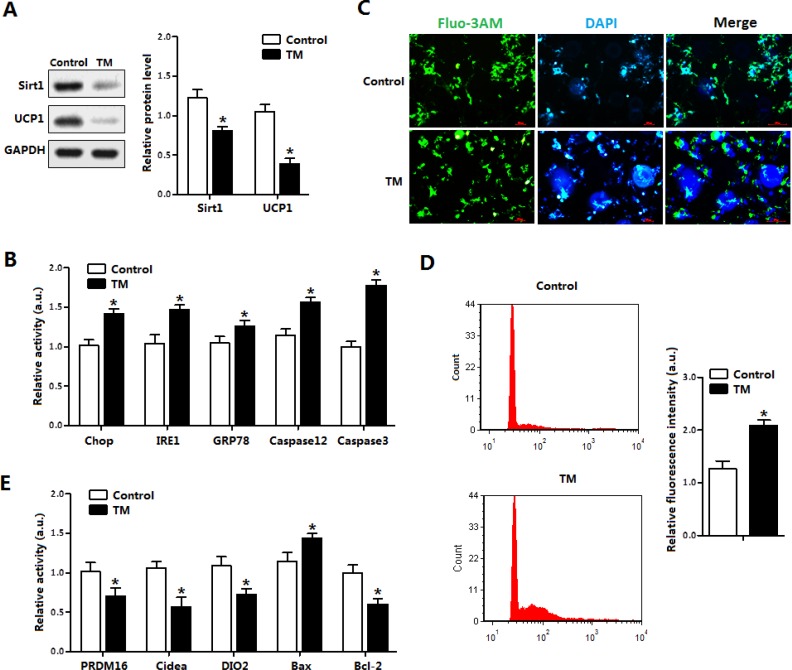
Figure 3. ER stress inhibited Sirt1 expression and damaged UCP1 function in brown adipocytes.
(A) Protein level of Sirt1 and UCP1 with tunicamycin (TM, 1 μg/mL) incubation for 12 h in brown adipocytes (n = 3); (B) Protein levels of Chop, IRE1, GRP78, Caspase12 and Caspase3 of brown adipocytes with TM incubation for 12 h (n = 3); (C) Cytosolic Ca2+ in brown adipocytes with TM incubation for 12 h (n = 3); (D) Flow cytometry (FCM) analysis of Cytosolic Ca2+ in Figure 3C (n = 3); (E) Protein level of PRDM16, Cidea, DIO2, Bax and Bcl-2 of brown adipocytes incubated with TM for 12h. Protein level was measured by ELISA test (n = 3). Values are means ± SEM, *p < 0.05 compared with the control group.

