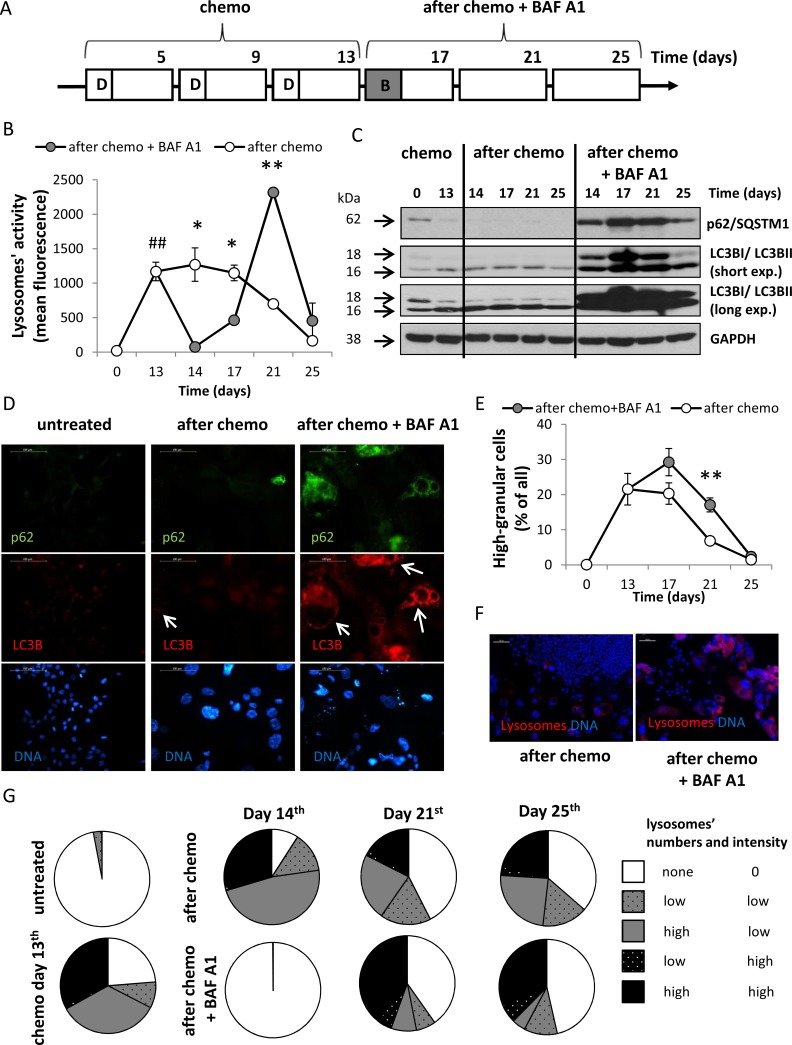
Figure 3. A single pulse of BAF A1 transiently blocks autophagy in senescent HCT116 cancer cells.
(A) A scheme of the experiment. After the 3rd doxorubicin cycle HCT116 cells were left untreated (AFTER CHEMO protocol) or were treated with 10 nM bafilomycin A1 (BAF A1, B) for 24 hours (AFTER CHEMO + BAF A1 protocol). Then, cells were cultured in a complete medium for the next 13 days; a medium was changed every four days. (B) Quantification of lysosomal activity with Lysotracker staining using flow cytometry. (C) Representative blots show the level of p62 and LC3BI/II proteins. GAPDH served as a loading control. (D) Visualization of p62 and LC3B in untreated and treated cells on the 17th day. Representative photos show LC3B staining–visualized as red (AlexaFluor 488), p62–as green (AlexaFluor 555), nuclei–as blue (H33342). Puncta of LC3BII are indicated by white arrows. Original magnification 400×. Data were acquired using fluorescence microscopy. Scale bar–100 μm. (E) Quantification of percentages of high-granular cells by flow cytometry using FSC/SSC analysis. (F) Visualization of lysosomal activity in untreated and treated cultures on the 21st day with Lysotracker–visualized as red, nuclei were stained with H33342–visualized as blue. Original magnification 100×. Data were acquired by fluorescent microscopy. Scale bar-100 μm. (G) Evaluation of number and intensity of lysosomes at various times after treatment. Analysis of images of cells stained with Lysotracker (stains lysosomes) and H33342 (stains nuclei). Cells were divided in terms of lysosomes number and fluorescence intensity. Each bar represents mean ± SEM, N ≥ 3. #p < 0.05, ##p < 0.01, ###p < 0.001 untreated vs. CHEMO (day 13th); *p < 0.05, **p < 0.01, ***p < 0.001–AFTER CHEMO vs. AFTER CHEMO + BAF A1.

