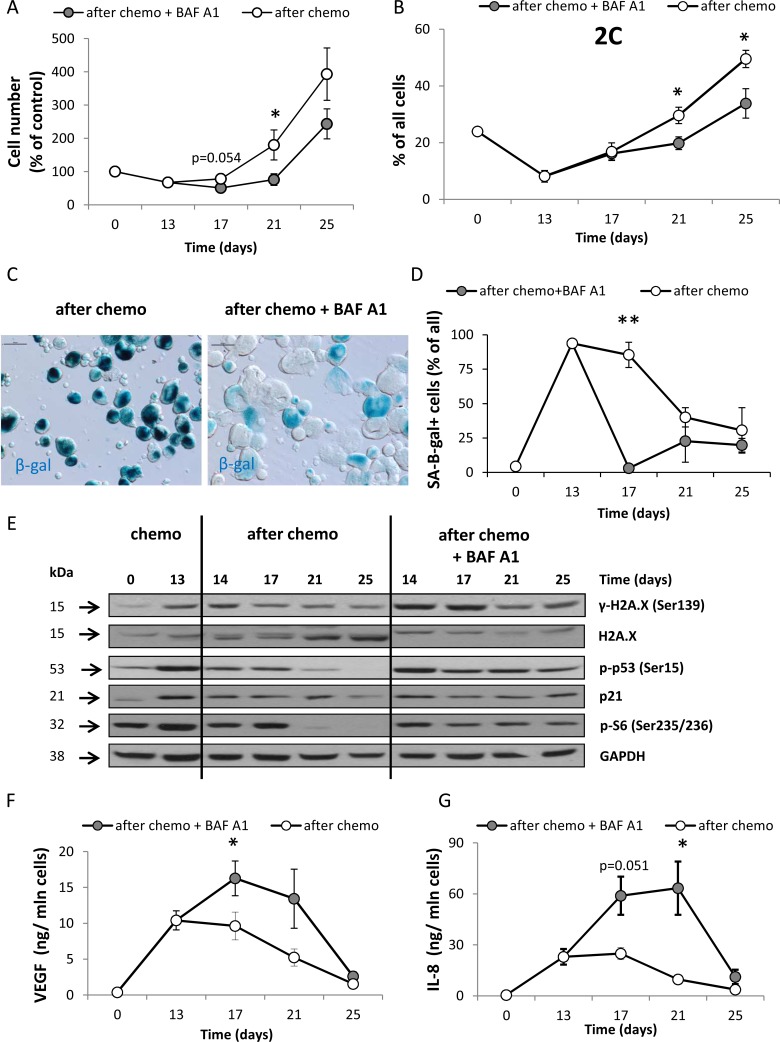
Figure 4. A single pulse of BAF A1 transiently delays re-population of HCT116 cell cultures.
(A) Evaluation of cell number in cultures treated with the AFTER CHEMO or the AFTER CHEMO + BAF A1 protocol at various times. Cells were counted in Bürker's chamber. (B) Quantification of percentages of diploid progeny entering G0/G1 phase (with 2C DNA content). Cell cycle analysis was performed using PI staining and flow cytometry. (C) Detection and quantification of senescent cells using SA-β-gal staining on cytospined cells. Representative photos were acquired using light microscopy on the 21st day; original magnification 200×; scale bar– 100 μm. (D) Quantification of SA-β-gal+ cells in treated cultures. (E) Representative blots show the levels of DDR and geroconversion proteins: γ-H2A.X, H2A.X, p-p53, p21 and p-S6. Detection of GAPDH served as a loading control. (F–G) Secretion of SASP cytokines VEGF (F) and IL-8 (G) in supernatants harvested from treated cultures was determined by colorimetric ELISA. Results were normalized to total cell number counted in Bürker's chamber. Each bar represents mean ± SEM, N ≥ 3.*p < 0.05, **p < 0.01, ***p < 0.001–AFTER CHEMO vs. AFTER CHEMO + BAF A1.

