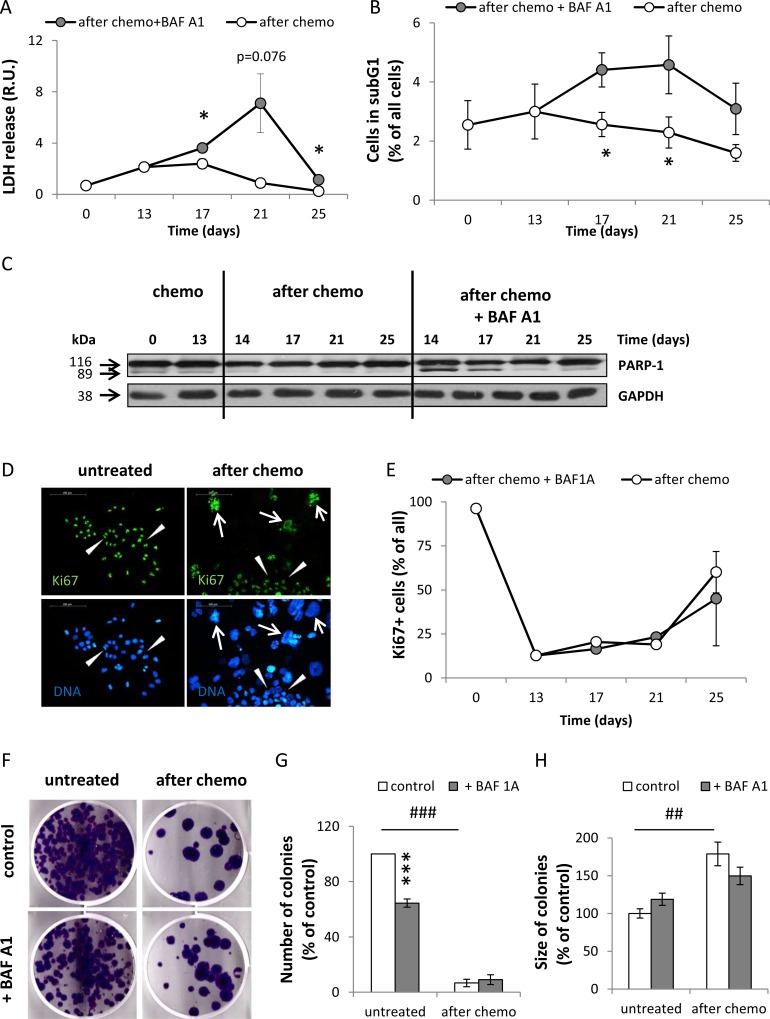
Figure 5. Senescent HCT116 cancer cells are resistant to BAF A1 treatment.
(A) Evaluation of cell mortality using LDH assay. Cells were treated with the AFTER CHEMO or the AFTER CHEMO + BAF A1 protocol. Results were normalized to total cell number counted in Bürker's chamber. (B) Quantification of percentages of cells in the subG1 phase (with DNA content < 2C). Cell cycle analysis was performed using PI staining and flow cytometry. (C) Representative blot shows the level of PARP-1. GAPDH served as a loading control. (D) Representative photos show Ki67 staining in untreated and HCT116 cells treated with the AFTER CHEMO protocol on the 21st day: Ki67 visualized as green (AlexaFluor 488), and nuclei visualized as blue (H33342). Ki67+ polyploid cells are indicated by white arrows, Ki67+ progeny or untreated HCT116 cells indicated by white arrowheads. Original magnification 200×. Data obtained by fluorescent microscopy. Scale bar–100 μm. (E) Automatic evaluation of percentage of Ki67 positive cells. (F) Visualization of colonies formed by untreated and doxo-treated cells co-incubated with BAF A1. Doxo-treated cells (1 000 cells/6-well plate) were harvested and seeded on the 14th day just after BAF A1 removal. Medium was replaced every week. Representative photos were taken three weeks after seeding. (G). Evaluation of numbers of colonies formed by untreated or doxo-treated cells co-incubated with BAF A1. (H) Evaluation of size of colonies formed by untreated or doxo-treated cells co-incubated with BAF A1. Each bar represents mean ± SEM, N ≥ 3.*p < 0.05, **p < 0.01, ***p < 0.001 –AFTER CHEMO vs. AFTER CHEMO + BAF A1, #p < 0.05, ## p < 0.01, ###p < 0.001 - untreated vs. AFTER CHEMO.

