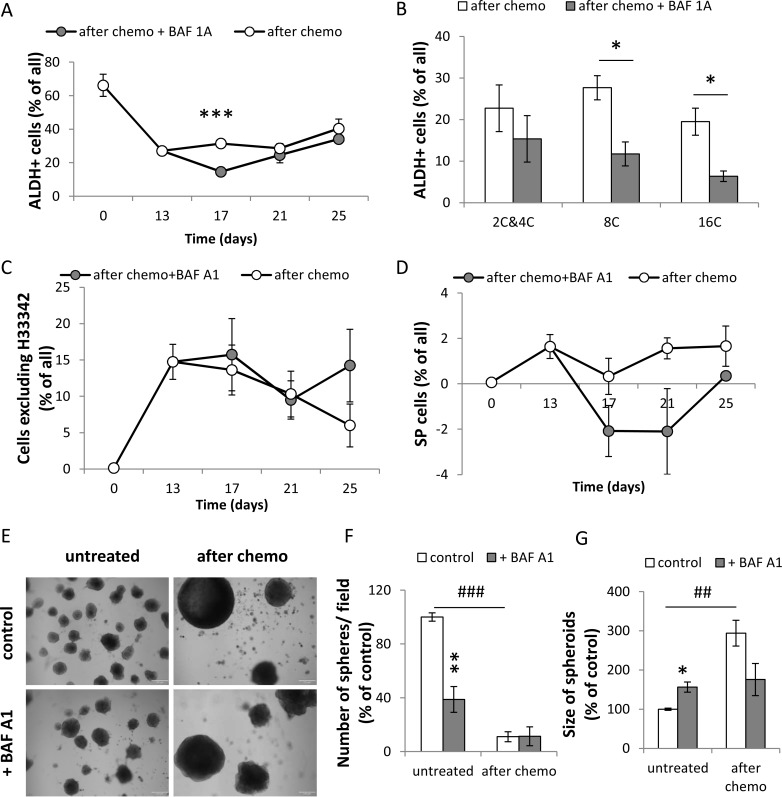
Figure 7. A single pulse of BAF A1 transiently impairs ALDH activity and H33342 exclusion in senescent HCT116 cells.
(A) Evaluation of percentages of HCT116 cells treated with the AFTER CHEMO protocol or the AFTER CHEMO + BAF A1 protocol showing ALDH activity at various time points. Cells co-incubated with DEAB, an ALDH inhibitor, served as a negative control. (B) Evaluation of percentage of HCT116 cells showing ALDH activity on the 17th day. Cells stained with H33342, as a ploidy discriminator, were stained for an ALDH activity. Percentage of cells with: 2C&4C, 8C and 16C DNA content displaying ALDH activity were determined by flow cytometry. (C) Quantification of cells excluding H33342 by flow cytometry. (D) Quantification of side population (SP). SP = a percentage of cells excluding H33342 in the absence of Verapamil minus a percentage of cells excluding H33342 in the presence of Verapamil. Cells stained with H33342 were co-incubated with Verapamil and analyzed by flow cytometry. (E) Visualization of spheroids in matrigel formed by untreated and doxo-treated cells co-incubated with BAF A1. Doxo-treated cells (1 000 cells) were seeded on the 14th day just after BAF A1 removal onto 96-well plate. Media were replaced every week. Representative photos were taken three weeks after seeding. Scale bar–100 μm. (F) Evaluation of the number of spheroids formed by untreated or doxo-treated cells co-incubated with BAF A1. (G) Evaluation of size of spheroids formed by untreated or doxo-treated cells co-incubated with BAF A1. Spheroids in the middle of well (hot spot) were calculated. Each bar represents mean ± SEM, N ≥ 3.*p < 0.05, **p < 0.01, ***p < 0.001–AFTER CHEMO vs. AFTER CHEMO + BAF A1.

