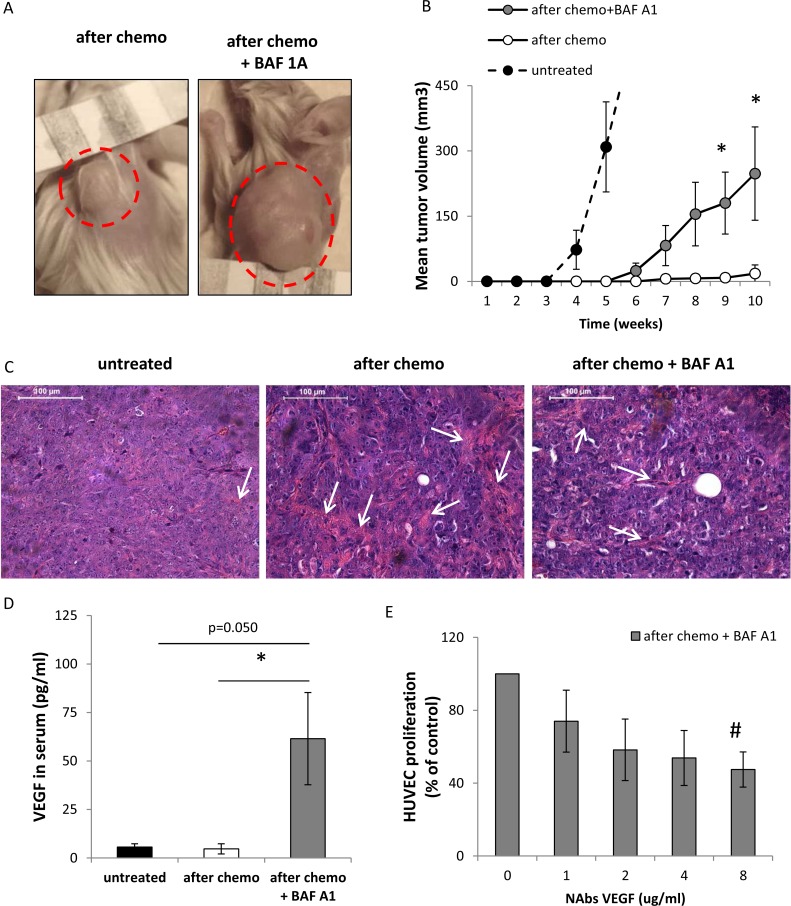
Figure 8. Pulse BAF A1 treatment of senescent HCT116 cells accelerates tumor growth in NOD/SCID mice.
Cells treated with the AFTER CHEMO or the AFTER CHEMO + BAF A1 protocol for 14 days were trypsinized, counted and injected in the back of NOD/SCID mice (5 000 cells in 100 μl matrigel mixed with PBS, 1:1); n = 7. Untreated HCT116 cells were used as controls, n = 6. (A) Representative photos show tumors (indicated by red dotted circles) at the end of the experiment. In AFTER CHEMO group, the tumor grew in 1/7 mice. (B) Quantification of mean volume of tumors according to formula: V = D × d2 × 0.5 (V is the tumor volume, D is the biggest dimension, d is the smallest dimension). (C) Histological evaluation of tumors. H&E staining was performed on paraffin-embedded sections. Representative photos show tumor morphology with collagen fibers (pink strands) indicated by white arrows. Original magnification 400x. Data acquired by light microscopy. Scale bar–100 μm. (D) Evaluation of human VEGF in sera of NOD/SCID mice by colorimetric ELISA specific for detection of human proteins. (E) Proliferation of HUVEC cells in response to conditioned media harvested from HCT116 cells treated with the AFTER CHEMO + BAF A1 protocol. Media were pre-incubated with an isotypic or a VEGF-neutralizing antibody (NAbs-VEGF) and proliferation of HUVEC cells using BrdU colorimetric assay was performed 48 hrs later. Each bar represents mean ± SEM. N ≥ 3. *p < 0.05, **p < 0.01, ***p < 0.001–AFTER CHEMO vs. AFTER CHEMO + BAF A1.

