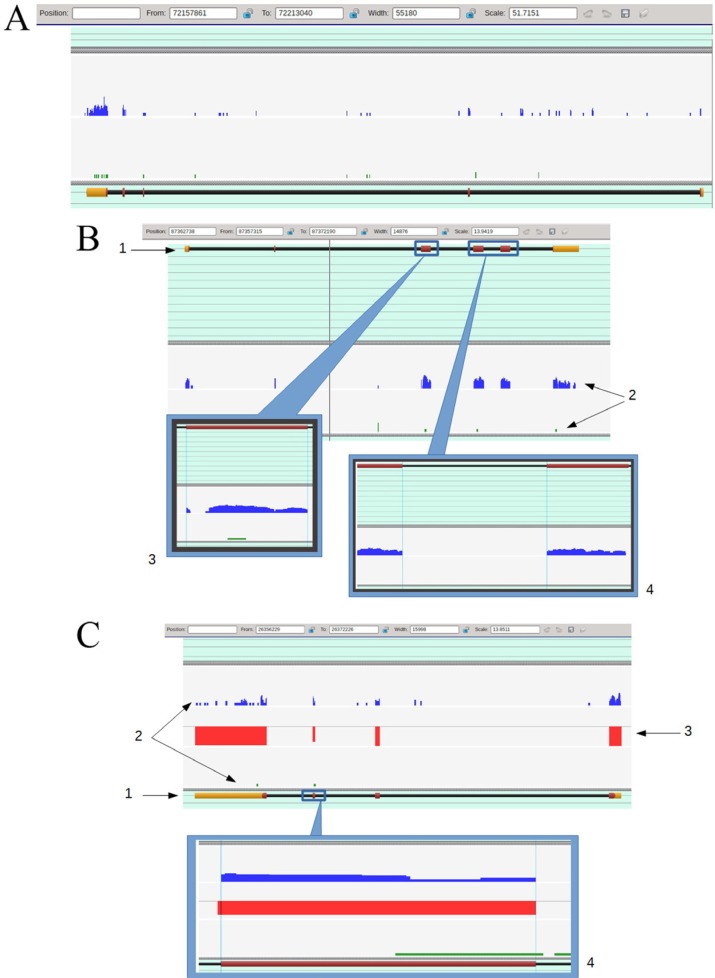
Figure 2.
(A) The general view of the expression profiles for TAMRA+ (blue profile) and TAMRA– (green profile) cells overlaid to melanoregulin gene (Mreg, uc007bkg.2, chromosome 1, – strand) marking. The gene consists of 5 exons visualized as yellow and dark purple filled rectangles. The yellow color corresponds to non-coding (untranslatable) sequences, the dark purple one – to coding sequences. Both profiles contain peaks that lay inside the boundaries of the gene, but in the case of TAMRA– cells, most of them are located over introns and therefore present no interest for us, while the TAMRA+ profile contains the peaks exactly corresponding to exons. (B) The detailed view of expression profiles for TAMRA+ (blue profile) and TAMRA– (green profile) cells overlaid to Cd5l gene (Cd5l, uc008psa.2, chromosome 3, + strand) marking. 1 – Gene layout. The gene consists of 6 exons that are drawn as filled rectangles over the black line, which in turn represents the gene's location over the chromosome. The yellow color corresponds to non-coding sequences, the dark purple– to coding sequences. Exons are counted from left to right. 2– Expression profiles for TAMRA+ (the upper blue profile) and TAMRA – (the lower green profile). The peaks height represents the number of reads dropped to a certain chromosome region. 3 – Detailed view of exon 3. It is demonstrative that despite the gap inside the exon's boundaries (marked by vertical blue lines), the short tails of the reads were aligned precisely to the exon layout. TAMRA– profile also contains a single read that dropped to this exon. We cannot determine whether this event is accidental or not, since it cannot be discriminated by nucleotide mismatching or supported by intronic evidence. 4 – Detailed view of exon 4 to exon 5 junction. It is demonstrative that “after splicing” the expression profile would be smooth and continuous. (C) The detailed view of expression profiles for TAMRA+ (the blue profile) and TAMRA– (the green profile) cells overlaid to Claudin 1 gene (Cldn1, uc007yuz.2, chromosome 16, – strand) marking. 1 – Gene layout. 2 – Expression profiles. 3 – “Contrasting bar”. This “profile”, which consists of red bars representing the difference between two expression profiles exactly inside exons boundaries, is used just for greater convenience in the visual analysis. The higher the bar, the more significant the difference is. The absolute difference (one of profiles contains no reads dropped to a certain exon) is represented by a full bar and corresponds to 100%. The direction of a bar (up or down) displays the profile with a lower expression level. It can be seen that TAMRA – cells profile demonstrates almost absolute lack of expression. 4 – Detailed view of exon 3. The TAMRA– profile contains a single read dropped to exon but its right tail lays outside the exon's boundary, which means the accidental nature of this event. In fact, we have an absolute difference between TAMRA+ and TAMRA– profiles, but the viewer had drawn a limited difference bar due to “formal hit” in TAMRA– profile.

