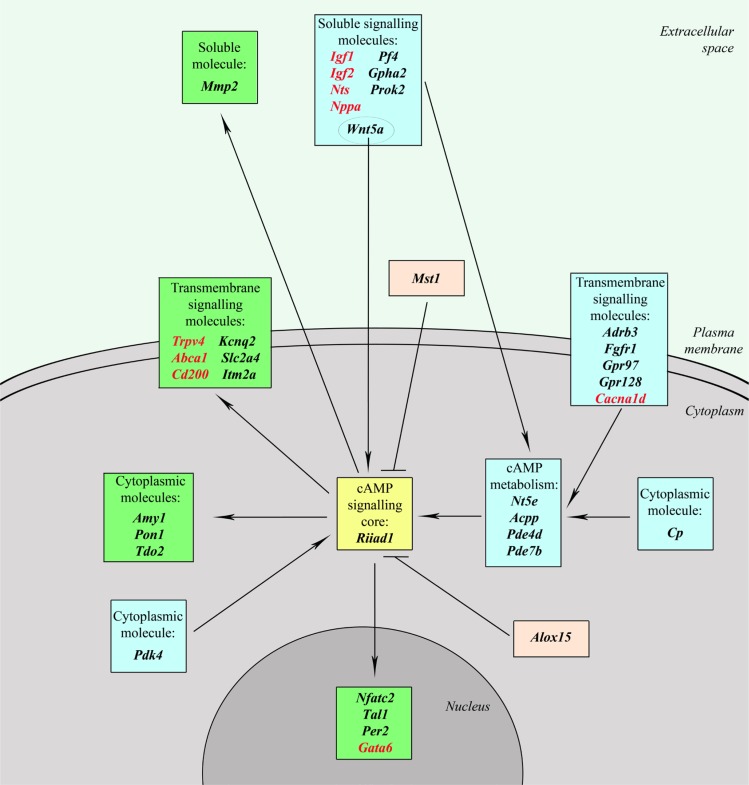
Figure 3. The cAMP-dependent signaling network.
Genes forming cAMP signaling core are shown in yellow; blue denotes upstream genes that regulate cAMP metabolism and activity of the signaling core; green – downstream genes that are affected by cAMP-signaling system; pink – genes which have an inhibitory effect on cAMP signaling pathway; genes that can form a positive feedback are shown in red.

