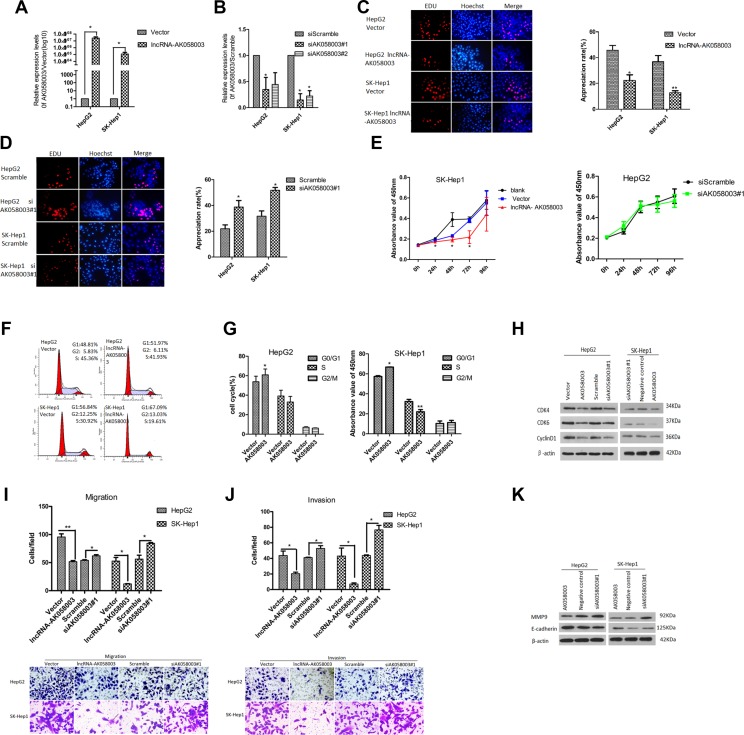
Figure 2. LncRNA-AK058003 inhibited cell proliferation, migration and invasion processes in vitro.
(A) HepG2 and SK-HeP1 stably over-expressing lncRNA-AK058003 cell lines were showed to have significantly increased expression levels of lncRNA-AK058003 compared to vector controls. (B) siRNA mediated knock-down of lncRNA-AK058003 (siAK058003) in HepG2 and SK-HeP1 cell lines were decreased significantly compared to scramble controls. (C) LncRNA-AK058003 up-regulated and (D). lncRNA-AK058003 down-regulated HepG2 and SK-HeP1 cell lines were seeded into 96 well plates and cell proliferation was assessed by EdU immunofluorescence staining. The proliferation ability value is in red. Original magnification, ×400. The barplot on the right shows the percentage of EdU-positive nuclei, indicating lncRNA-AK058003 notably restrained cell multiplication. (E) CCK8 assays showed that cell proliferation was suppressed by lncRNA-AK058003 overexpression in SK-HeP1 cells. The right curves show no significant difference in lncRNA-AK058003 down-regulated HepG2 cells. (F, G) FACS analysis showing a significant increase in the G1 phase in HepG2 and SK-HeP1 cells overexpressing lncRNA-AK058003. (H) The total protein expression of CDK4, CDK6, and cyclinD1 were detected by western blot analysis. Representative images of (I) transwell migration and (J) invasion assays in up-regulated and siRNA mediated knock-down of lncRNA-AK058003. Original magnification, × 400. (K) The metastasis related proteins (MMP9, E-cadherin) were performed in lncRNA-AK058003-overexpressing and lncRNA-AK058003- down-regulating HepG2 and SK-HeP1 cells by Western blot analysis. Data are shown as the mean ± S.E.M. based on three independent experiments. *p < 0.05, **p < 0.01, ***p < 0.001.

