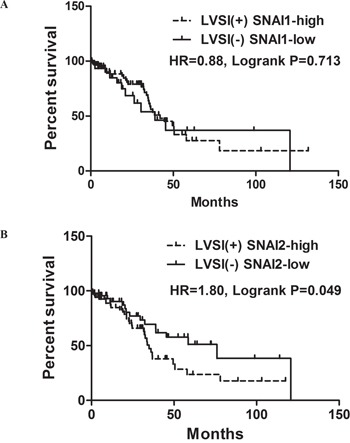
Figure 5. Survival curves with Kaplan-Meier method and Log-rank test for p-values.

A. OS for combination patters of LVSI and SNAI1; B. OS for combination patters of LVSI and SNAI2.

A. OS for combination patters of LVSI and SNAI1; B. OS for combination patters of LVSI and SNAI2.