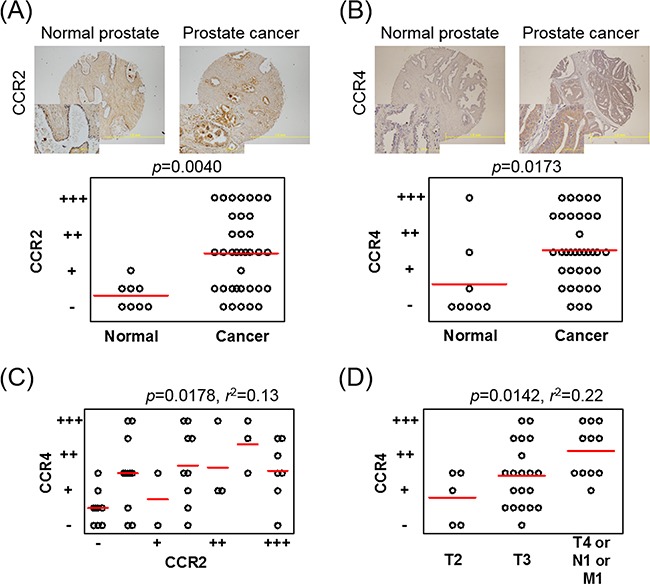
Figure 5. CCR4 and CCR2 are increased in prostate cancer tissues on IHC staining.

A, B. A TMA plate containing tissue samples from 8 patients with normal prostates and tissue samples from 36 patients with prostate cancer is used, and one or two spotted tissues from each patient are placed on the plate. IHC staining of CCR2 (A) and CCR4 (B) is performed and scored on a scale from – to +++, according to intensity. Patients having two spotted tissues are scored using the average value. C. Correlation between the staining intensities of CCR2 and CCR4 in each patient is analyzed using Pearson's correlation coefficient test. D. The CCR4 staining intensity is analyzed according to the progression of TNM stage. One-way ANOVA is performed. Bars indicate the mean of each group.
