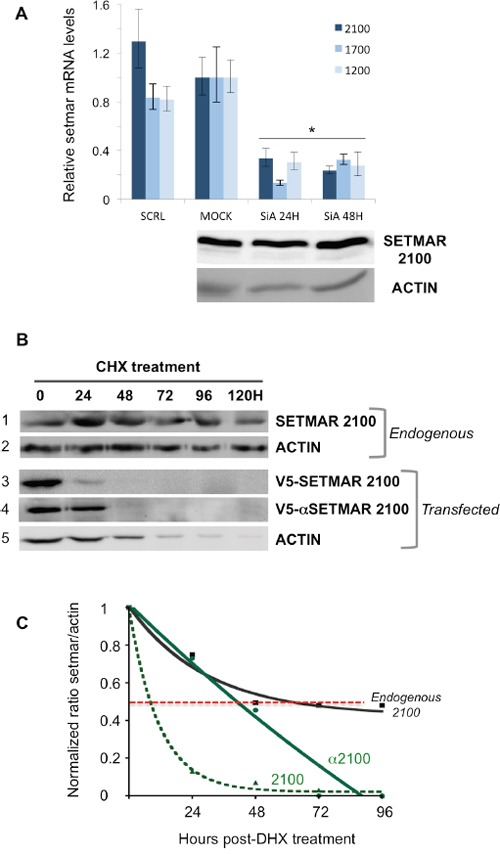
Figure 3. Stability of SETMAR products.

A. siRNA assays. Cells were transfected with siRNA directed against exon 3 in order to silence all SETMAR mRNA. Top panel: The relative quantity for each mRNA was generated from triplicate RTqPCR reactions following normalization to GAPDH. Ct differences between the 2100-mRNA, 1700-mRNA or 1200-mRNA in 8MGBA (taken as references) and other transcripts were calculated. The fold difference for each mRNA was calculated using ΔΔCt method. Bars are medians ± SD. SCRL: 8MGBA transfected with a scramble siRNA and collected 48H post-transfection. MOCK, non-transfected 8MGBA. SiA: 8MGBA transfected with a specific SETMAR siRNA and collected 24 or 48H post-transfection, as specified. Bottom panel: Western blot analysis of crude extracts after the cells were treated as described for the top panel. Bands were visualized using an anti-SETMAR antibody. The detected proteins are indicated in the left. ACTIN was used as a control. B. Western blot analyses of crude extracts after the cells were treated by CHX. Bands were visualized using an anti-SETMAR antibody (for the endogenous protein in 8MGBA, track 1) or an anti-V5 antibody for recombinant proteins transfected in 8MGBA (tracks 3 and 4). ACTIN was used as a standard (tracks 2 and 5). C. Quantification of SETMAR proteins half-life. Signals recovered in (B) were quantified. For each point, ratios of SETMAR on ACTIN signals were reported as a function of time. Half-lives correspond to the time needed to lose half of the original amount (dotted red line). Black line: endogenous SETMAR; straight green line: V5-α2100-SETMAR; dashed green line: V5-2100-SETMAR.
