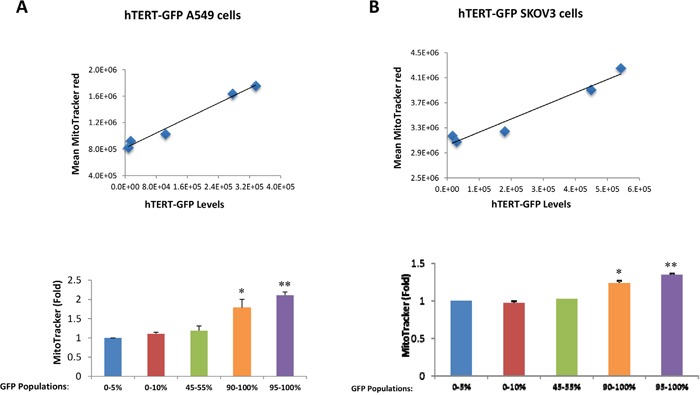
Figure 2. hTERT-high cells show a significant increase in mitochondrial mass.

A549 and SKOV3 cells stably-transduced with the hTERT-eGFP reporter were subjected to flow cytometry to identify the GFP(+) and GFP(-) cell populations. In addition, the cells were also counter-stained with MitoTracker Deep Red to correlate their mitochondrial mass with GFP intensity. Five different cell populations with different GFP intensities were considered in this analysis. Note that panel A shows that mitochondrial mass increases with increasing GFP levels in hTERT-GFP A549 cells. Panel B illustrates that similar results were observed with hTERT-GFP SKOV3 cells. Therefore, higher telomerase activity correlates with increased mitochondrial mass in both cell lines. N=3 independent experiments, with 2 technical replicates for each experiment. Bar graphs are shown as the mean ± SEM; t-test, two-tailed test *p < 0.05, **p < 0.001.
