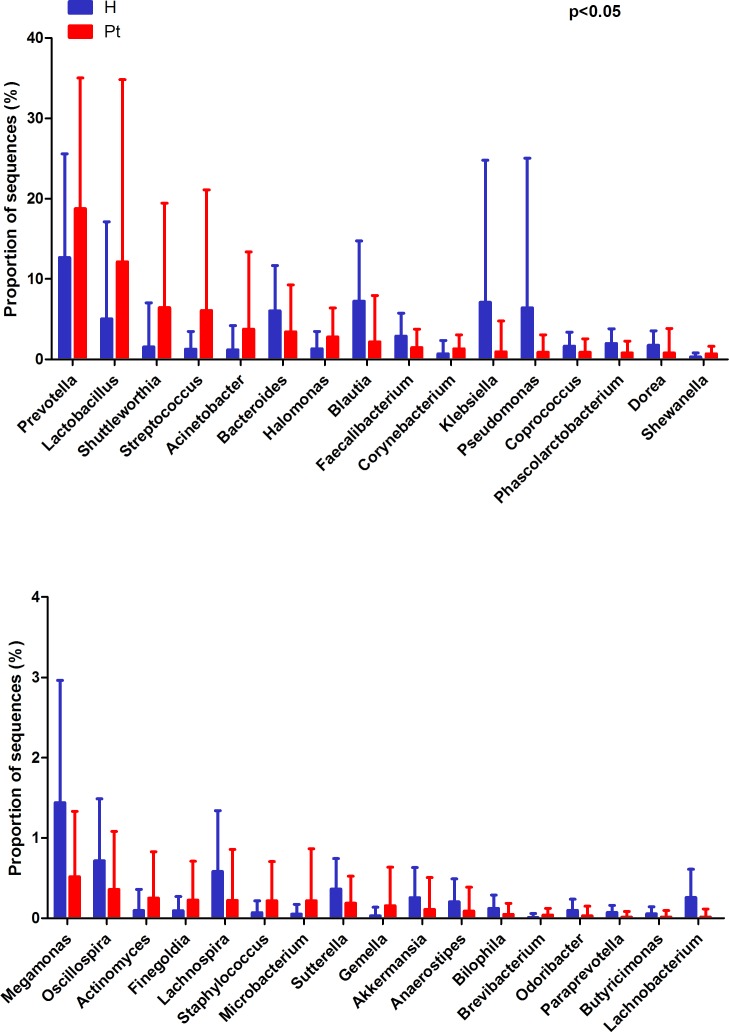
Figure 2. Genus-level OTUs different between the two cohorts (Mean ± SD).
Welch’s t-test was used to compare the abundance at the bacterial genus level between HCs and T2DM patients. The different genera were assigned only to those presenting a minimum variation at a significant level [p (corrected) < 0.05)]. H and Pt represent healthy controls and T2DM patients, respectively.

