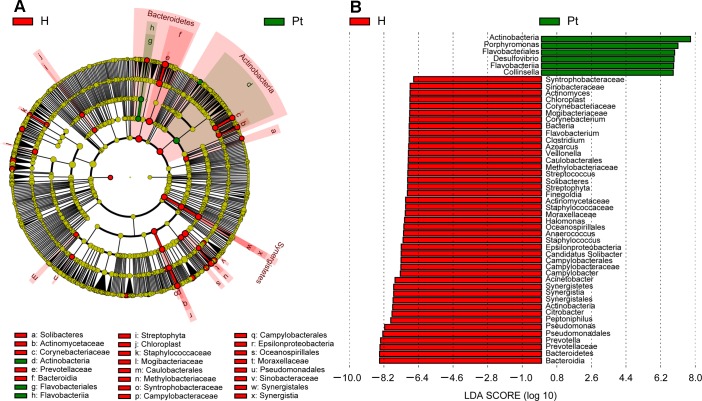
Figure 3. Cladogram showing differentially abundant taxa of microbiota.
A. LEfSe cladogram showed the most differentially abundant taxa between the two cohorts. Taxonomic cladogram obtained from LEfSe analysis of 16S sequences. Taxa enriched for HCs in red; T2DM enriched taxa in Green. The brightness of each dot is proportional to its effect size. B. Only taxa meeting an LDA threshold > 1.8 are shown. H and Pt represent healthy controls and T2DM patients, respectively.

