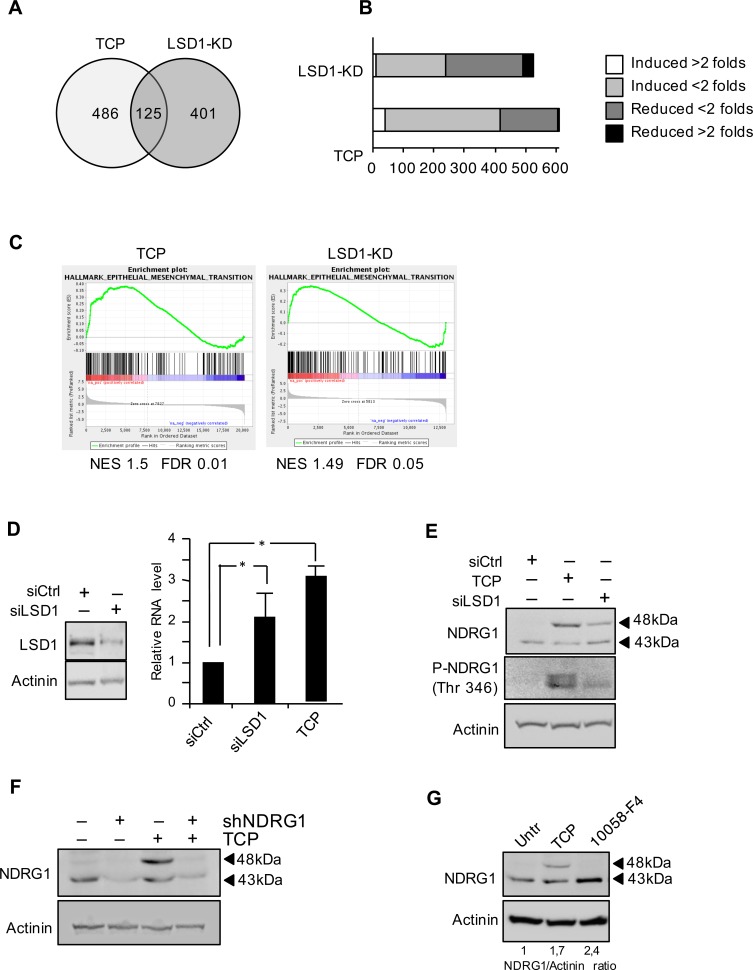
Figure 1. A. Venn diagram of the DEG present in both LSD1-knockdown (LSD1-KD) and TCP treatment.
B. Gene set of regulated genes by TCP treatment and LSD1-KD. C. Gene set enrichment analysis (GESA) plots show enrichment of gene sets regulated by LSD1-KD and TCP treatment. In each panel, nominal NES and false discovery rates (FDRs) are indicated. D. NDRG1 gene expression was analyzed by qRT-PCR, using samples prepared from Tet-21/N cells and treated with TCP or siRNA-LSD1 and siRNA-control as indicated. LSD1 protein level in Tet-21/N cells transfected with siRNA-LSD1 or control was determined by western blot. *, statistical significance (P < 0.01; Student t test). E. Western blotting of protein extracts from Tet-21/N cells prepared as described in D, using NDRG1 and phospho-NDRG1 (Thr 346) antibodies. F. NDRG1 silencing using sh-NDRG1 in Tet-21/N cells treated with TCP or vehicle, was assayed by western blot. G. Western blotting of protein extract from Tet-21/N treated with vehicle, TCP or 10058-F4 for 48 hrs, using NDRG1 antibody. Actinin has been probed as loading control.

