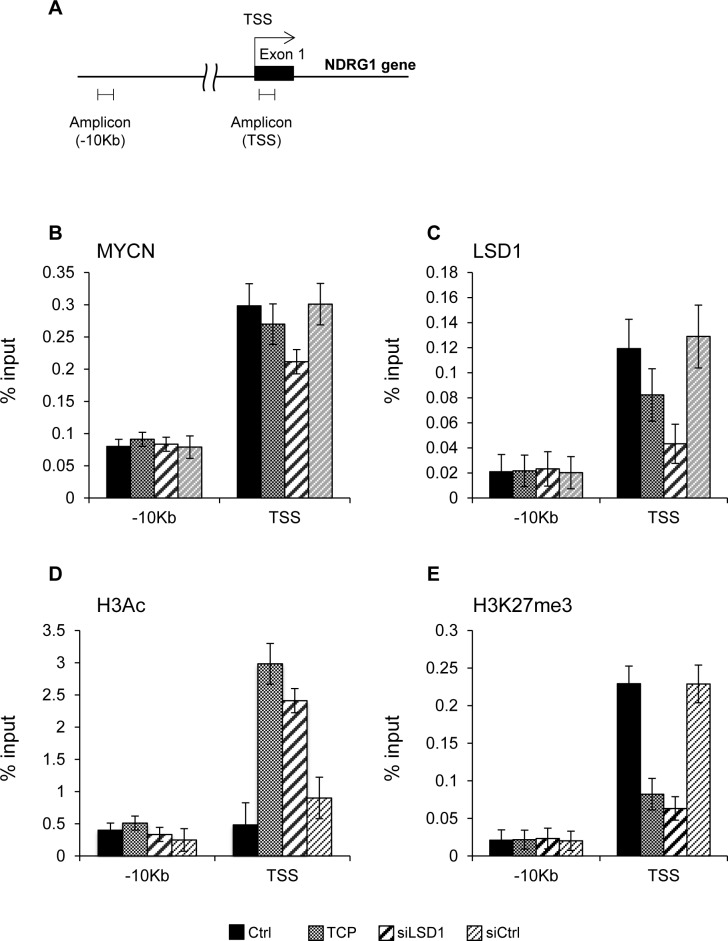
Figure 2. A. Schematic representation of the NDRG1 promoter.
B. and C. MYCN and LSD1 binding to NDRG1 chromatin. Cell treatments are indicated at the bottom of the figure. qPCR was performed with primers for NDRG1 TSS, and -10kb. D. and E. Histone modifications at NDRG1 chromatin; ChIPs were carried out using the indicated antibodies and analyzed with primers encompassing the TSS region and -10kb from TSS. Values from three independent ChIP assays are presented along with standard deviations, n = 3. Changes in % input are shown normalized over IgG controls and are all statistically significant (P < 0,05; Student t test).

