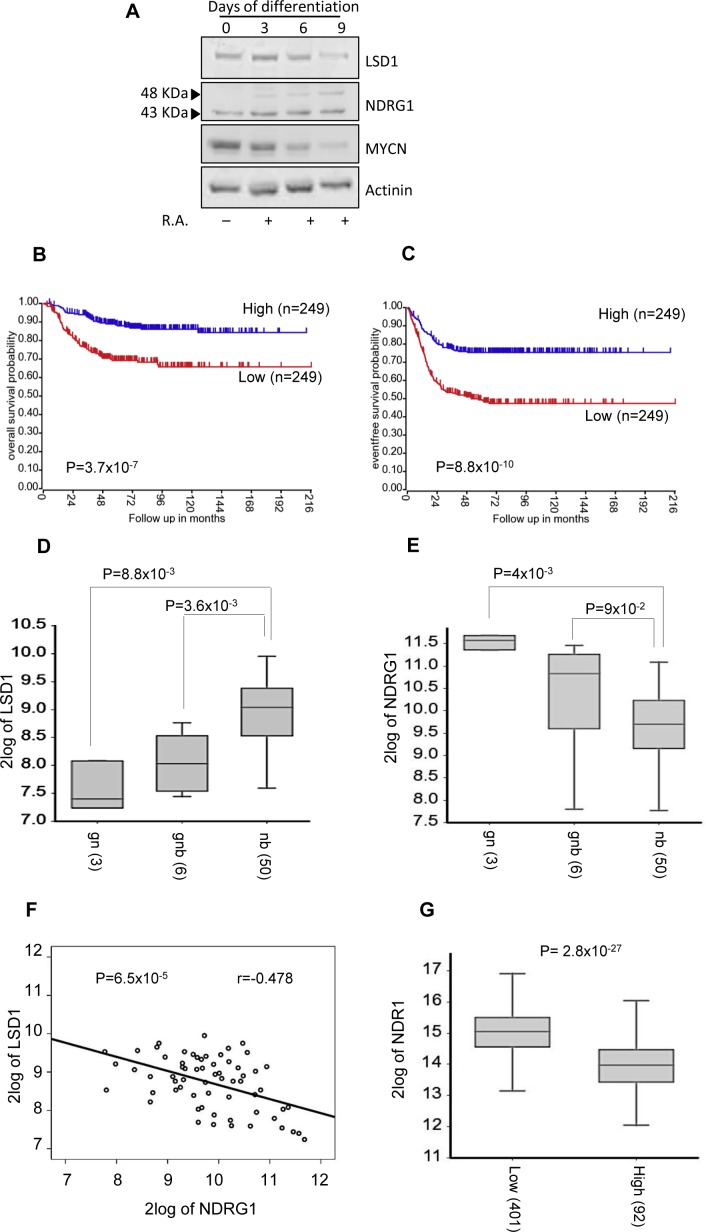
Figure 7. A. SK-N-BE (2) cells were treated with RA up to 9 days. LSD1, NDRG1 and MYCN protein levels were detected in differentiated SK-N-BE (2) cells at the indicated days by western blotting.
NDRG1 expression is associated with good outcome and differentiated tumors. B. and C. Low NDRG1 expression is associated with negative prognosis. The number of tumors is indicated in parentheses. Kaplan-Meier analysis is shown, with individuals grouped by median of expression of NDRG1. Log-rank P values are shown. Changes in expression for LSD1 D. and NDRG1 E. in ganglioneuroblastoma (GNB), ganglioneuroma (GN) and neuroblastoma (NB). F. Inverse correlation between the expression values of NDRG1 and LSD1 in NB tumors (Pearson's correlation coefficient is shown). G. Box plot showing differential NDRG1 expression in NB tumors without (Low) or with (High) MYCN amplification.

