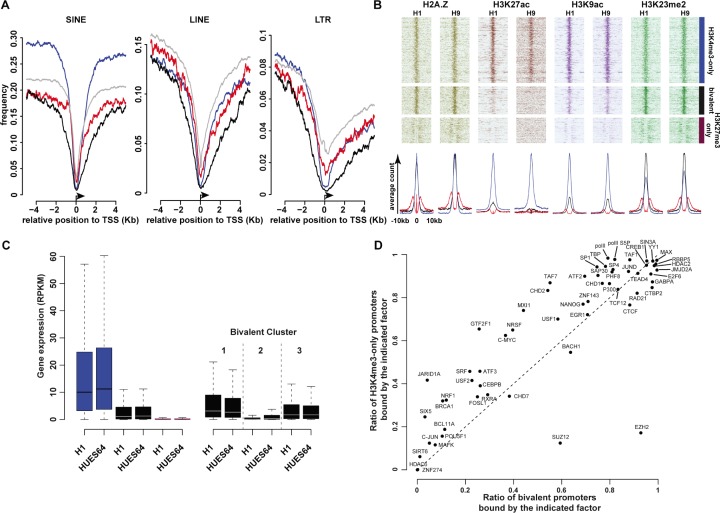
Figure 2. Main molecular signatures associated with high-confidence H3K4me3-only, bivalent and KH3K27me3-only regions.
(A) Frequency of retroelements at all (gray lines); H3K4me3-only (blue lines); bivalent (black lines) and H3K27me3-only (purple lines) promoters (± 4 Kbp from the TSS). (B) Occupancy of histone marks at H3K4me3-only; bivalent and H3K27me3-only promoters in H1 and H9 hESC lines. Each line represents one promoter; ChIP-seq read densities for a ± 10Kbp window are centered on the peak signal. The associated average counts are shown in the lower panel. (C) Expression level of genes with H3K4me3-only (blue columns), bivalent (black columns) or H3K27me3-only (purple columns) promoters in H1 and HUES64 hESC lines (left histogram). The right histogram shows the expression level of genes with bivalent promoters belonging to cluster 1, 2 and 3, respectively. (D) Transcription factor occupancy at bivalent promoters and in H3K4me3-only promoters.

