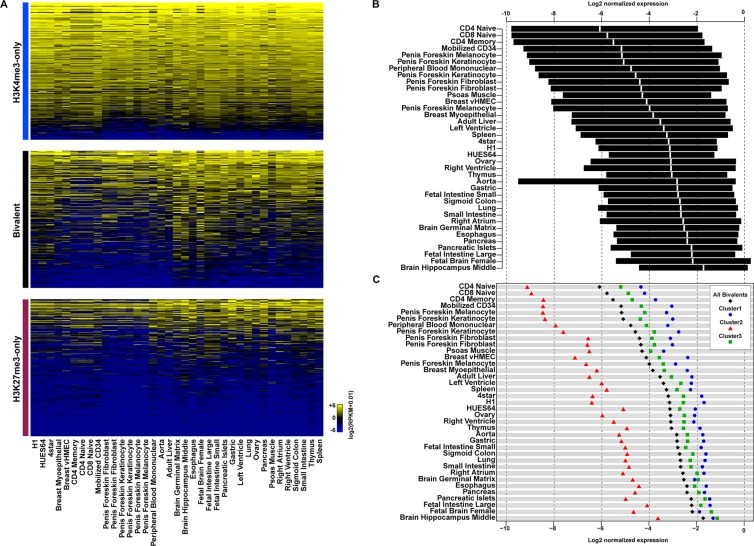
Figure 4. Genes with bivalent promoters in human ES cells are differentially expressed in committed cell lineages.
(A) Expression level in tissues and primary cell lines of genes with H3K4me3-only (upper panel), bivalent (middle panel) and H3K27me3-only (lower panel) promoters in hESCs. Expression level (in RPKM) is denoted by the color scale (blue to yellow: −6 to +6 on a log2 scale). (B) Interquartile range of expression in tissues and primary cell lines of genes with a bivalent promoter in hESCs. The median is shown in white. (C) Median expression in tissues and primary cell lines of genes with bivalent promoters (all, black diamonds), bivalent promoters belonging to cluster 1 (blue circles), cluster 2 (red triangles) or cluster 3 (green squares). In (B) and (C) gene expression level was normalized to the median of the expression of H3K4me3-only promoter-associated genes from the same tissue.

