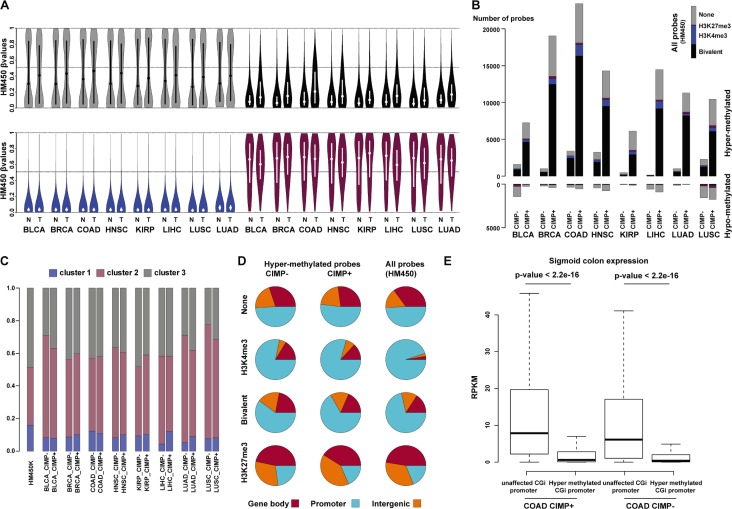
Figure 6. Bivalent CGIs from cluster 2 are the main target of aberrant hypermethylation in cancer.
(A) Violin plots of CGI β value for none (gray), bivalent (black), H3K4me3-only (blue) and H3K27me3-only (purple) regions in eight types of solid tumors (T) and matched normal (N) tissues. The mean β values are plotted on the y-axis, with the median indicated by a dot in the violin. (B) Distribution of hyper- and hypo-methylated probes in tumor and matched control tissues according to their chromatin signatures in hESCs (none: gray; bivalent: black; H3K4me3-only: blue; H3K27me3-only: red). For each tumor type, CIMP-positive (+) and CIMP-negative (−) samples were analyzed separately. As a reference, the distribution of all HM450K probes according to their chromatin signatures in hESCs is shown in the upper right corner. (C) Relative distribution of hypermethylated probes at bivalent regions (cluster 1 to 3). (D) Genomic features associated with hypermethylated probes according to the chromatin signature in hESCs and the CIMP status of the analyzed tumor samples (merged for all tumor types). Distribution on the whole HM450K array (all probes) is shown as reference. (E) Genes with aberrantly hypermethylated CGI/promoter in colon adenocarcinoma tend to be repressed in healthy colon tissue. Boxplot representation of the expression levels measured in healthy colon for genes with unaffected or hypermethylated CGI/promoter in CIMP-positive (+) and CIMP-negative (−) colon adenocarcinoma samples (p-value: Mann-Whitney test). BLCA: bladder urothelial carcinoma; BRCA: breast invasive carcinoma; COAD: colon adenocarcinoma; HNSC: head-neck squamous cell carcinoma; KIRP: kidney renal papillary cell carcinoma; LIHC: liver hepatocellular carcinoma; LUSC: lung squamous cell carcinoma; LUAD: lung adenocarcinoma.

