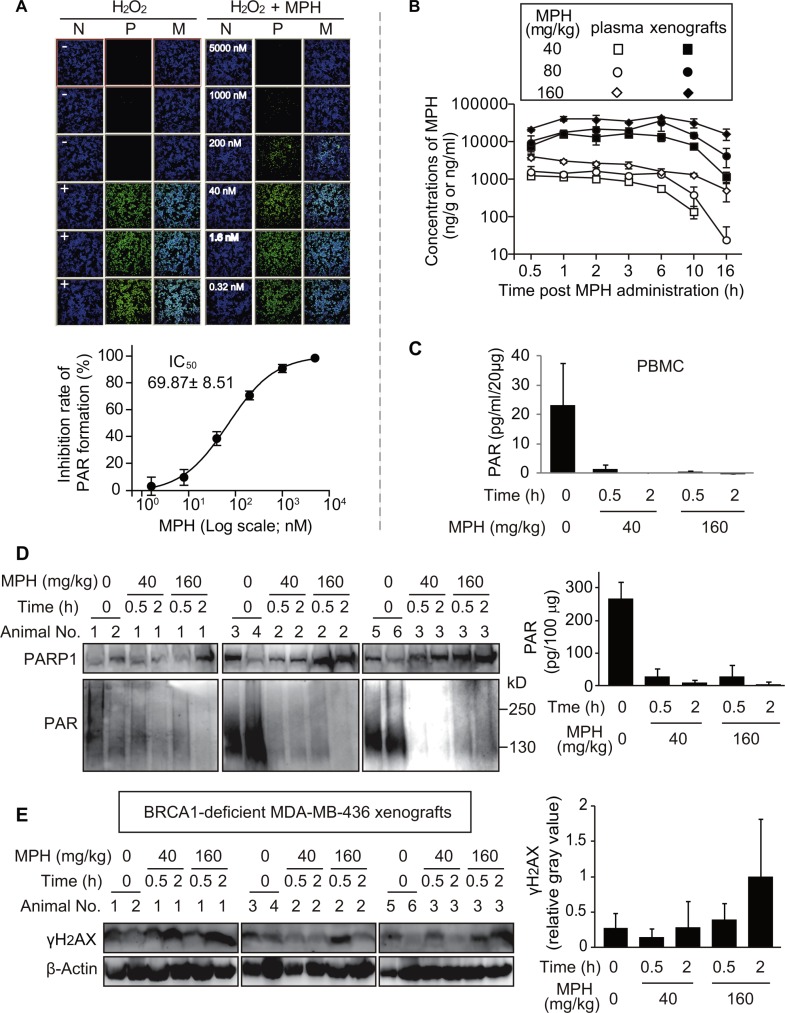
Figure 4. Pharmacodynamic biomarker analyses reflecting the in vitro and in vivo activities of MPH.
(A) MPH prevented the H2O2-triggered formation of PAR in BRCA2-deficient Capan-1 cells. Upper: representative images of PAR formation. Nuclei stained with DAPI indicated the cell density; the FITC images revealed the levels of cellular PAR. N, nuclei; P, PAR; M, merged. Lower: The concentration-response curve quantitatively showed the inhibition of PAR formation by MPH. The data were expressed as mean ± SD, obtained from the upper images and from three independent experiments. (B) the time-concentration curve of MPH in plasma and xenografts following a single-dose oral administration to the nude micebearing BRCA1-deficient MDA-MB-436 subcutaneous xenografts (The same models were also used in (C–E). C, the levels of PAR formation in peripheral-blood mononuclear cells (PBMC) assayed by ELISA. Data were presented as mean ± SEM showing a representative data from two independent experiments, and three animals in each group. D and E, the levels of PAR (D) and γH2AX (E) in MDA-MB-436 cells of the xenografts determined by Western blotting. Left, representative images; right, semi-quantitative results (mean ± SD) from the corresponding images. Six animals in vehicle group, three animals in each MPH treated group.

