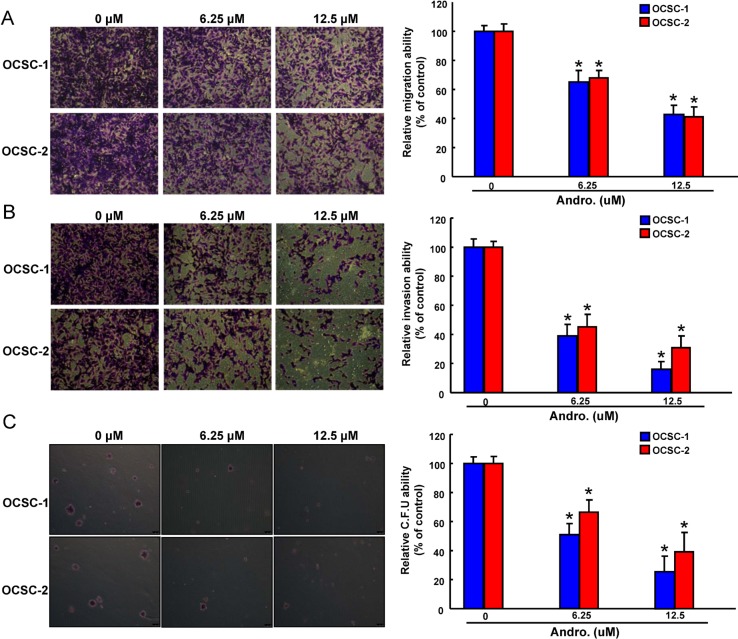
Figure 3. Anti-oncogenic effect of andrographolide in OCSCs Representative images (left) and quantification (right) of.
(A) migration assay, (B) Matrigel invasion assay and (C) soft agar colony formation assay of OCSCs treated with various concentration of andrographolide. Experiments were performed in triplicate. Values are expressed as mean ± SD. *p < .05 compared to control.

