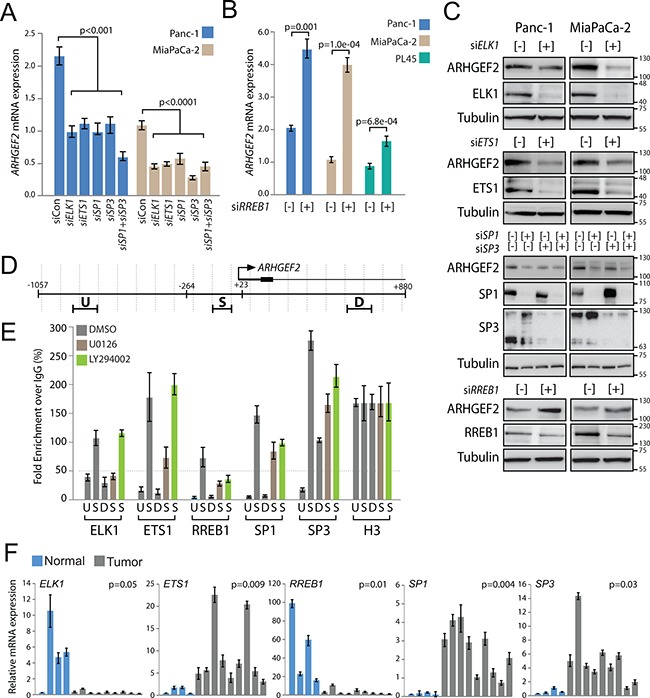
Figure 4. Validation of endogenous ARHGEF2 transcriptional regulation.

A. QPCR analysis of ARHGEF2 expression in Panc-1 and MiaPaCa-2 cells 72 hours post transfection with control siRNA or siRNA against the indicated TFs. B. QPCR analysis of ARHGEF2 expression in the indicated PDAC cell lines 72 hours post transfection with control siRNA (−) or siRNA targeting RREB1 (+). C. Western blot analysis of ARHGEF2 in Panc-1 and MiaPaCa-2 cells 72 hours post transfection with control siRNA (−) or siRNA against the indicated transcription factors (+). Lysates were probed with indicted antibodies 48 hours post treatment. D. QPCR amplicons for ChIP were designed within 100-bp windows at the TSS (S), upstream of amplicon S (U), or downstream of amplicon S (D). The position of the highly conserved minimal promoter (−264 to +23) sequence is mapped relative to the TSS and the ChIP amplicons. E. QPCR analysis of chromatin immunoprecipitates from Panc-1 cells treated with DMSO, MEK inhibitor (U0126) or PI3K inhibitor (LY294002). Fold enrichment is calculated as the signal obtained after immunoprecipitation with the indicated antibody over IgG antibody and normalized to the signal obtained for histone H3 ChIP. The 50-fold enrichment threshold for positive transcription factor binding is indicated with a dashed line. Data are mean ± SEM from three independent measurements. F. QPCR analysis of the indicated TF expression in normal pancreas (Normal) and patient-derived xenografts (Tumor). The p value represents significance between normal and tumor group.
