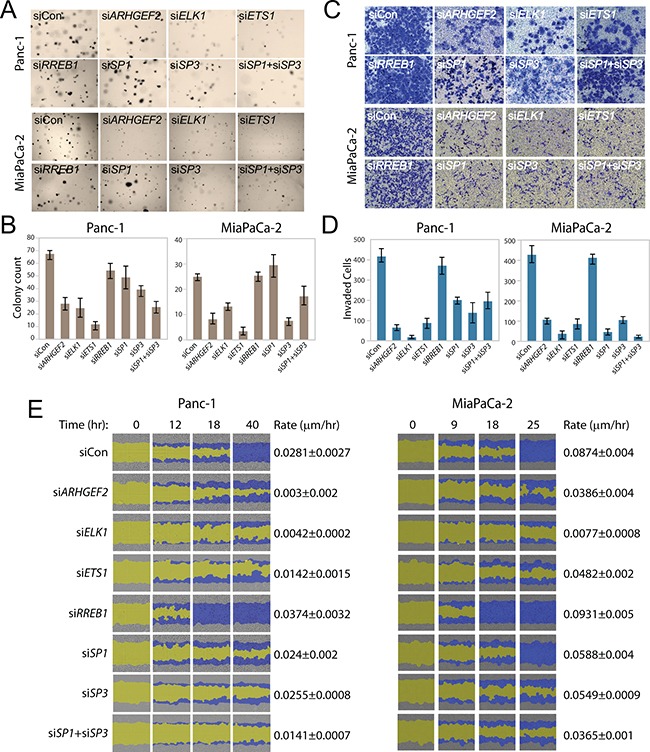
Figure 5. Transcription factors regulating ARHGEF2 mediate RAS transformed phenotypes.

A, B. Representative images (A) and quantification (B) of Panc-1 and MiaPaCa-2 cells transfected with the indicated siRNA and grown for 7 days in 0.3% agar to form colonies. Bar graphs average colony counts from three representative images. C, D. Representative images (C) and quantification (D) of invasion assays in Panc-1 and MiaPaCa-2 cells through matrigel coated transwells following transfection with the indicated siRNAs. Bar graphs indicate the average number of invasive cells from three representative images. E. Scratch wound assay of Panc-1 and MiaPaCa-2 cells transfected with indicated siRNA and monitored over the time course. Images from Essen IncuCyte ZOOM. The initial scratch wound mask is colored yellow and the progression of cell migration is marked blue. Rate constants were derived by fitting wound closure curves to a first order rate equation (μm/hr).
