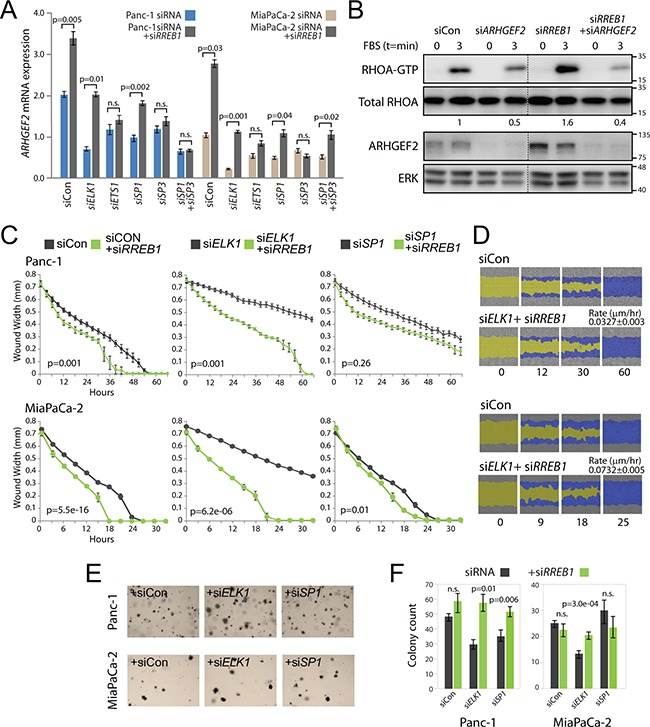
Figure 6. RREB1 knockdown restores ARHGEF2 expression in the absence of ELK1 or SP1 to activate migration and colony formation.

A. QPCR analysis of ARHGEF2 mRNA in Panc-1 and MiaPaCa-2 cells 72 hours post transfection with the indicated siRNA or siRNA plus siRREB1. P-values measure the statistic relevance of altered ARHGEF2 expression between siRNA or siRNA plus siRREB1. For this and subsequent statistical analysis n.s. equals not significant. B. Western blot analysis of RHOA-GTP activation in Panc-1 cells transfected with the indicated siRNAs. 48 hours post siRNA transfection, serum starved cells were lysed (t=0 min) or stimulated with FBS (t=3 min) and then lysed. Lysates were incubated with Rhotekin-RHO binding domain protein beads, purified and subjected to western blot analysis. The ratio of RHOA-GTP/total RHOA is indicated. ERK served as a loading control. C. Wound width analysis of Panc-1 and MiaPaCa-2 cells transfected with the indicated siRNA (grey line) or siRNA plus siRREB1 (green line) monitored over the time course. Graphs were generated with the Essen IncuCyte ZOOM. P-values calculated from wound width analysis at 40 hour time point (Panc-1) and 18 hour time point (MiaPaCa-2). D. Representative scratch wound images of Panc-1 and MiaPaCa-2 cells transfected with siCon (from Figure 5E) or siRNAs targeting ELK1 plus RREB1. The initial scratch wound mask is colored yellow and the progression of cell migration is marked blue. The rate constants for wound closure for the combined knockdown of ELK1 and RREB1 are indicated (μm/hr). E, F. Representative images (E) and quantification (F) of Panc-1 and MiaPaCa-2 cells transfected with the indicated siRNA or the indicated siRNA plus siRNA targeting RREB1 and grown for 7 days in 0.3% agar to form colonies. Bar graphs indicate the average colony counts from three independent experiments.
