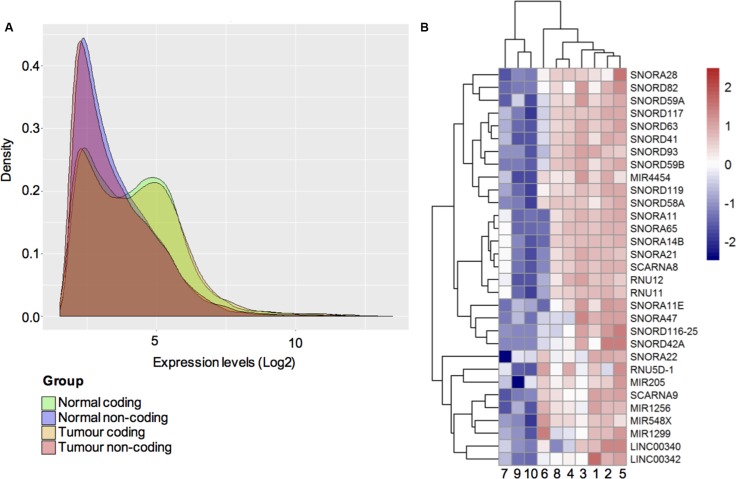
Figure 2.
(A) Distribution of gene expression levels. A frequency histogram representing the distribution of expression levels of protein-coding and ncRNA transcripts in ameloblastoma tumours and non-ameloblastoma control tissues. The green peak indicates the expression of protein-coding genes in control tissue, orange peak distribution of coding genes in ameloblastoma, whereas pink peak indicates the expression of ncRNA in ameloblastoma tumours and purple peak the non-ameloblastoma control tissues. (B) Heat map and clustering dendrogram illustrating differential expression of ncRNAs in ameloblastoma and non-ameloblastoma tissue. In total 31 significantly upregulated ncRNAs were expressed in ameloblastoma tumour samples (samples: 1, 2, 3, 4, 5, 6) as compared to non-ameloblastoma control tissue (samples: 7: follicular cyst; 8: Oral lichen planus; 9–10: periradicular granuloma). The colour scale shown illustrates the relative expression level of ncRNAs across all samples. Colours can be interpreted using the scale where red colour represents an expression level > 2.0 in fold change and blue colour represents expression level <−2.0 in fold change. The length of the branch between two samples correspond to degree of similarity between the expressions of ncRNAs.

