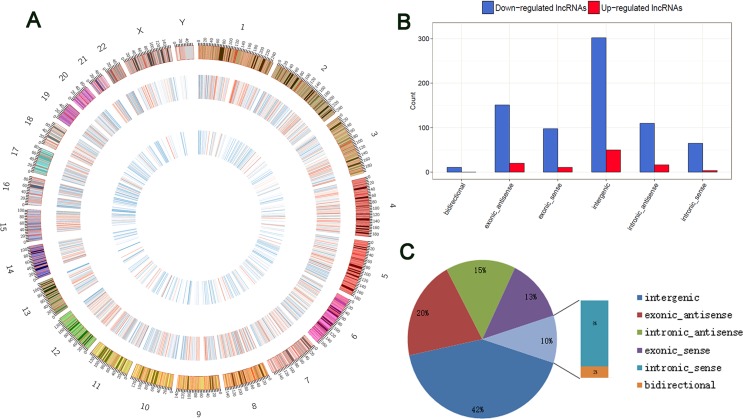
Figure 2. Identification of differentially expressed lncRNAs in GA.
(A) Circos plot showing lncRNAs on human chromosomes. The outermost layer of circos plot is chromosome map of the human genome. The increased or decreased lncRNAs have been marked in red or blue bars, respectively. The larger inner circle represents all target lncRNAs detected by RNA-seq, and the smaller inner circle indicates the significantly differentially expressed lncRNAs with fold change > 2.0 and FDR < 0.1. (B) Categories and counts of differentially expressed lncRNAs (FC > 2 and FDR < 0.1). The lncRNAs are classified into six types according to the relationship with their associated coding genes. (C) Pie charts show the proportion of six types of dysregulated LncRNAs in GA compared to the normal tissue.

