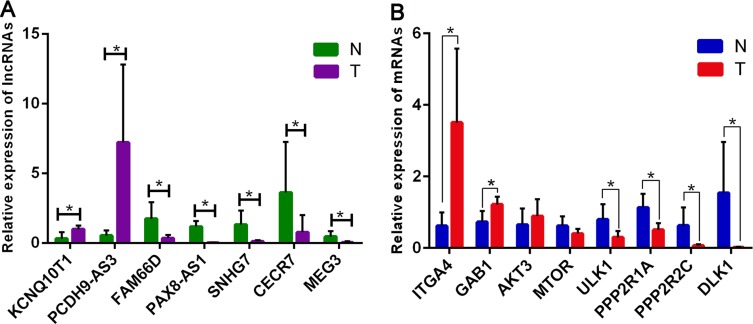
Figure 6. Validation of expression of significant lncRNAs and mRNAs by qRT-PCR.
The relative expression levels of seven lncRNAs (A) and eight mRNAs (B) are shown comparing GA tumor samples (T) with normal tissue controls (N). The relative expression level of each lncRNA and mRNA was normalized, and data displayed in histograms are presented as means ± SD, *P < 0.05.

