
Figure 6. Correlation of miR-182 and SNAI1 expression with metastatic colonization.
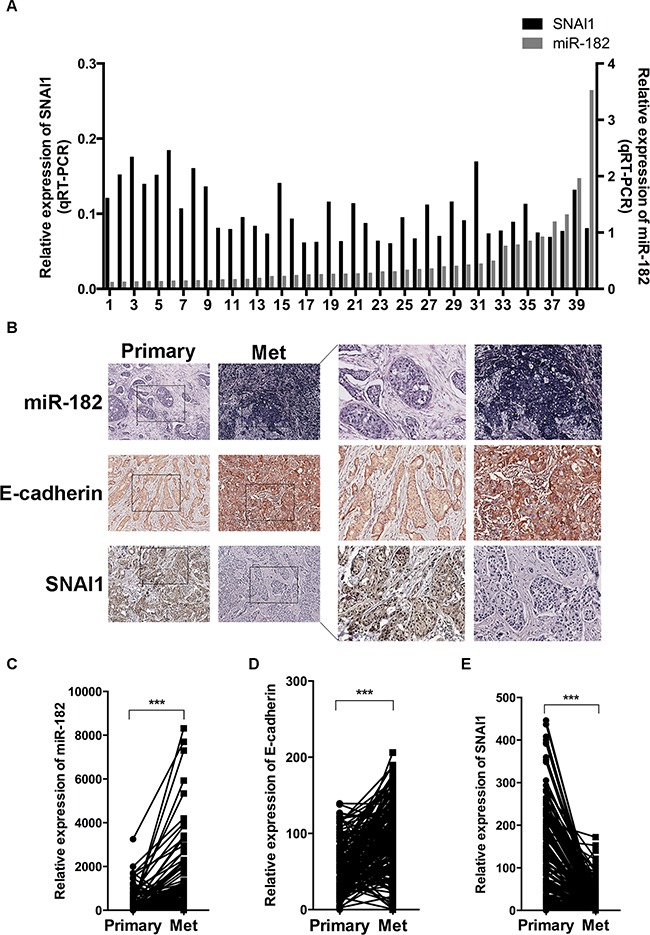
A. Expression of miR-182 (gray, right Y axis) and SNAI1 (black, left Y axis) in 40 fresh frozen primary breast tumor specimens, examined by qRT-PCT. The values were normalized to U6 and GAPDH, respectively. B-E. Histological analysis of miR-182, E-cadherin and SNAI1 expression in primary breast cancer tissues (Primary) and paired metastatic lymph nodes (Met). The tissue microarray containing primary breast cancer tissues and paired metastatic lymph nodes was stained using a miR-182 probe (ISH) and specific antibody against E-cadherin or SNAI1 (IHC) as described in Materials and Methods, respectively. Here show representative photographs of ISH results of miR-182 and IHC results of E-cadherin and SNAI1 in breast cancer specimens (B), and the analysis of miR-182 (C), E-cadherin (D) and SNAI1 (E) expression in these specimens. Original magnification, ×400. *P<0.05, **P<0.01. ***P<0.001.